Sales, Digital Marketing, and Business Development expert with a love for all things real estate. Real Estate has been a passion of mine for many many years, and no matter what type of business venture or career I am involved in, locally I will always be engaged in the real estate industry as an agent, investor or developer.
Luckily for us, Senator Tim Scott has been on our side pushing for FEMA to look at our flood plains and rezone Charleston SC’s over 20 yr old flood levels. After 2015’s historic devastating flooding that wreaked havoc over almost the entire state, not just the low-country, but including the midlands it is about time the FEMA flood maps be reconfigured. The Senate and House have passed (March 2014) a bill to delay premium hikes for years on hundreds of thousands of homeowners who buy flood insurance from the federal government. Important points are:
The House bill caps annual price increases in order to prevent sticker shock, a move that will slow the pace of the authorized transition to actuarially sound policies. It also reinstates grandfathering of buildings built to a previous code standard. The new legislation would delay for up to four years huge premium increases that are supposed to phase in next year and beyond under new and updated government flood maps. It also would allow homeowners to pass below-cost policies on to people who buy their homes. The 67-32 vote reflects widespread concern about changes enacted two years ago to shore up the program’s finances. The changes are producing sky-high insurance rates that are unaffordable for many homeowners in flood-prone areas like Charleston whose insurance has historically been subsidized by the government and other policyholders.
Homeowners who upgrade to a new policy will be allowed to do so without being assigned to a new risk category. Homeowners who overpaid under the new rules will be reimbursed.
One proposal, by Sen. Pat Toomey, R-Pa., would proceed with the premium increases but cap them on most properties – including homes being sold – at 25 percent per year until the premium reflects the true flood risk. It faces almost certain rejection, though Toomey said it lines up with what the Obama administration wants. The administration said in a statement it “strongly supports a phased transition to actuarially sound flood insurance rates.”
The legislation is a win for coastal state Democrats like Sens. Mary Landrieu of Louisiana, Bill Nelson of Florida, and Bob Menendez of New Jersey, who have formed an unstoppable coalition with Republicans representing coastal areas and the Mississippi basin like Sen. John Hoeven of North Dakota.
The bill, however, contains no relief in the offing for 1.7 million owners of second homes, who are not covered by the Senate bill and who face annual 25 percent increases – provided they owned their home before Congress overhauled the program in 2012. They say the premium hikes threaten the viability of older beachfront towns.
(live5news.com)
CHECK YOUR HOME’S FLOOD ZONE LEVELS
As of March 20th 2015 the latest changes in flood insurance rates:
Rate Changes
We all know the chances of a flood are usually slim, but if it does happen the effects can be devastating. So making sure you are covered correctly will help ease this possibility. As much as 75% or more of the low-country is considered in a flood zone or possibility of flooding. More than 14,000 homes in the Charleston area will be affected by recent changes to the new FEMA flood program. FEMA is changing the flood lines, and expect that the new changes will cost you money if you are buying a home in Charleston. The biggest thing to consider is to avoid buying a home built prior to 1974 and to be even MORE careful don’t consider buying a home built before 1995. As there were building codes that were implemented in the 90’s to combat the threat of floods and insurance providers consider this. In most cases, the new rules for flood insurance will require almost every house being purchased or insured to have a current up-to-date elevation certificate done.
Depending on what is on the elevation certificate about where or how your home is situated as it pertains to the flood plain will determine your cost for flood insurance. Some other factors that will dictate your cost for flood insurance are the way the foundation was built, age of home, the height of the home, and the number of foundation vents, and their size (sq inches). There are a lot of factors that go into calculating your insurance costs so the best thing to do is to contact a licensed local agent to answer your questions. Increases in flood insurance premiums having negative effects on listing your home for sale. MORE HERE –>
UPDATE: 1/16/14: You may hear about a flood insurance premium delay in the Omnibus Appropriations Bill that passed Congress this week – this delay is for implementing future premium increases on grandfathered (post-FIRM) properties only for the next 9 months. This does not address the devastating subsidized (pre-FIRM) point of sale premium increases hurting our real estate market. The Omnibus Appropriations Bill prohibits funding for implementing future premium increases on “grandfathered properties” only. It does not include a delay for the home buyers who have already seen rate increases over the past year.
*The good news – the U.S. Senate plans to vote on legislation that would create a 4-year “time out” for both impacted home buyers and future increases on “grandfathered” properties. The Senate Majority Leader has promised the sponsors a vote on S. 1846 Homeowner Flood Insurance Affordability Act which would delay any increases for 4 years; they are currently negotiating the number of amendments and amount of debate time. The bill is expected to come up the week of January 27 if not as soon as today. Both South Carolina senators, Tim Scott and Lindsey Graham, are co-sponsors of S.1846. If it passes the U.S. Senate this month, it would still have to clear the U.S. House of Representatives and that is a high hurdle to clear — although Congressman Mark Sanford supports the bill.
SUBSIDIZED PROPERTIES This includes Pre-FIRM properties below Base Flood Elevation (BFE). Pre-FIRM in Charleston County means start of construction or substantial improvement was before 1975. To determine the pre-FIRM date for every city and county in South Carolina, click here.
Primary residences:
Beginning when the policy renews starting October 1, 2013, rates will move to full actuarial rates at the time the property sells (this will apply retroactively to all properties sold since July 6, 2012).
Non-primary residences, commercial properties and repetitive loss properties:
Beginning October 1, 2013 rates move to actuarial rates and premiums will increase 25% per year. The only way to know your full actuarial rate and to find your maximum premium is to have a current elevation certificate. Access FEMA’s 2013 Rate Schedule for second/vacation homes here (which includes the first 25% step increase)
Note: Rates are per $100 of coverage.
GRANDFATHERED PROPERTIES
This includes post-FIRM properties that were built at Base Flood Elevation, but BFE has since been raised since construction OR the property was mapped into a different flood zone.
Rates will be phased out and be brought to new actuarial rates only after the new flood rate maps are adopted. This is expected to be completed in South Carolina in late 2014 or early 2015.
ALL OTHER PROPERTIESREQUIRING FLOOD INSURANCE
All other properties will see rate increases of at least 5%, but possibly higher (in the 20% range), but each property is different.
(Source: http://www.charlestonrealtors.com/) Advise your clients to speak to an insurance agent before buying.
Downtown Charleston South Carolina Flood Prone Areas
(area in white is the worst)
If you don’t carry adequate flood insurance and you have a mortgage your lender will give you what is called FORCED PLACEDinsurance. Which is usually much more expensive then you would find on your own.
Secondly, flood insurance is flood insurance. There is NO shopping around for flood insurance. FEMA regulates flood insurance and its costs. Agents simply are the distributors of the policies. However, your insurance could vary in cost IF and only if the agent providing you the flood insurance quote makes a mistake in inputting the information therefore, affecting the rating adversely.
–In Charleston County, FEMA said all homes built before April 1971 pre-date the first flood map. In Dorchester County, the date is January 1982, and in Berkeley County it’s September 1983.
Homes built after flood maps were adopted will not see as much impact from the NFIP changes, but they could be affected by the new flood maps FEMA is developing for the entire United States, the agency said.
On Oct. 1, when parts of the new law kicked in, flood policies increased an average of 10 percent. Under the changes, subsidies are being removed from second homes, rentals and businesses, as well as dwellings that have had repeated flood losses. Homes sold in pre-FIRM areas are automatically required to have the much more expensive insurance that reflects the “true risk” of flooding. (Source – Post & Courier)-
Senior officials for NFIP said they are $24 Billion in debt following many recent disastrous storms in recent years as the costs and consequences of flooding continue to increase. “For decades the program subsidized rates and has made insurance available but didn’t reflect the true risk of flooding, and just like our health insurance system, artificially low rates and discounts are no longer sustainable”.
Rate changes are likely to affect owners of subsidized pre-FIRM non-primary residences, business properties, and properties that have experienced sever repetitive flood losses. Owners of pre-FIRM condos and multi-family units will also see their rates gradually increase. Owners of pre-FIRM primary residences will retain their subsidies unless the policy lapses; it suffers a severe, repeated loss’ or it’s sold to a new owner which is retro active to July 6th, 2012 when the legislation was enacted.
As FEMA improves its mapping technology and draws more accurate flood maps, some homes may now be located in a flood zone, or higher risk area, where the flood insurance is more expensive. Also, some insurance agents may adjust rates to correct previous mistakes made about the home’s features when they are re-evaluating a policy at renewal.
Below are the lists of things needed to get adequate flood insurance.
1.) An up to date, signed survey, with an elevation certification from a licensed professional (engineer, surveyor, architect) on the most recent FEMA form dated as of Jan 1, 2007. To see if your home is in a flood zone clickHERE.
2.) 2 dated photographs of the home both front and back within 90 days of requesting coverage.
Definitions of FEMA Flood Zone Designations : Charleston SC Flood Zones
ZONE
DESCRIPTION
B, C, and X
Areas outside the 1-percent annual chance floodplain, areas of 1% annual chance sheet flow flooding where average depths are less than 1 foot, areas of 1% annual chance stream flooding where the contributing drainage area is less than 1 square mile, or areas protected from the 1% annual chance flood by levees. No Base Flood Elevations or depths are shown within this zone. Insurance purchase is NOT required in these zones.
ZONE
DESCRIPTION
A
Areas with a 1% annual chance of flooding and a 26% chance of flooding over the life of a 30-year mortgage. Because detailed analyses are not performed for such areas; no depths or base flood elevations are shown within these zones.
AE, A1-A30
Areas with a 1% annual chance of flooding and a 26% chance of flooding over the life of a 30-year mortgage. In most instances, base flood elevations derived from detailed analyses are shown at selected intervals within these zones.
AH
Areas with a 1% annual chance of shallow flooding, usually in the form of a pond, with an average depth ranging from 1 to 3 feet. These areas have a 26% chance of flooding over the life of a 30-year mortgage. Base flood elevations derived from detailed analyses are shown at selected intervals within these zones.
AO
River or stream flood hazard areas, and areas with a 1% or greater chance of shallow flooding each year, usually in the form of sheet flow, with an average depth ranging from 1 to 3 feet. These areas have a 26% chance of flooding over the life of a 30-year mortgage. Average flood depths derived from detailed analyses are shown within these zones.
AR
Areas with a temporarily increased flood risk due to the building or restoration of a flood control system (such as a levee or a dam). Mandatory flood insurance purchase requirements will apply, but rates will not exceed the rates for unnumbered A zones if the structure is built or restored in compliance with Zone AR floodplain management regulations.
A99
Areas with a 1% annual chance of flooding that will be protected by a Federal flood control system where construction has reached specified legal requirements. No depths or base flood elevations are shown within these zones.
High Risk – Coastal Areas
In communities that participate in the NFIP, mandatory flood insurance purchase requirements apply to all of these zones:
ZONE
DESCRIPTION
V
Coastal areas with a 1% or greater chance of flooding and an additional hazard associated with storm waves. These areas have a 26% chance of flooding over the life of a 30-year mortgage. No base flood elevations are shown within these zones.
VE, V1 – 30
Coastal areas with a 1% or greater chance of flooding and an additional hazard associated with storm waves. These areas have a 26% chance of flooding over the life of a 30-year mortgage. Base flood elevations derived from detailed analyses are shown at selected intervals within these zones.
Ok.. So you have decided you want to build a new home, and you have obtained mortgage financing, now you have to figure out whatkind of new construction home build you want to do? Do you want a new fully custom home, tract built, or semi-custom? Well, regardless of which of those you choose aside from the choice of which home builder you want to hire to build it the next most important factor is your floor plan.
You might not think it’s that important because most are just so excited about having a new house, that their real estate agent will usually run them through a local community by a large national home builder and push them into something without sitting them down to discuss how they should pick out a plan. After all the agent isn’t the one that will be living there day in and day out, you will. Trust me you don’t want to get sucked into a house because you think it’s pretty on the inside or you like the vaulted ceilings, tile floors, or whatever only to regret it in a year because you now realize that the floor plan doesn’t fit your daily family needs. Unfortunately this happens all to often.
If you are going fully custom you will need to hire an architect and then you and your architect will usually talk about all these factors. Hiring an architect (if you can afford one) is definitely the way to go if you are building a custom home, because they can tailor the home to your needs, and they will suggest things you otherwise would have never thought of.
Let’s go over the questions you need to ask yourself when choosing a floor plan:
1.) How large is your family? Do you planning on having children? Although, you might not have kids now, if you plan on having them you should think about things like where is the laundry room (1st or 2nd floor), how large are the bedrooms and closets in the bedrooms, where are the bedrooms in relation to the exits of the home, where are the bedrooms in relation to the master bedroom and stairs. I think everyone knows that open floor plans are the rage, but when having children it is a must have. By having a very open floor plan allows you to be able to cook in the kitchen, sit in your office, or dining room and still easily see the kids to keep an eye on them.
2.) How old are you? How long do you plan on living in this home? If you are older and getting close to retirement you need to consider a one story home, house plan on a slab foundation instead of crawl space, or one with an elevator. Yes; I said elevator. Here in Charleston SC, real estate is commonly known to have elevators because much of our area is in a flood zone, and the lots are fairly small so homes can be close to one another and parking is best suited under the home. You may be nimble now, but as we age it becomes harder and harder to walk up stairs and get around and a home that accommodates your mobility needs is key. Where is the master bedroom located? Obviously, you won’t want to build or buy a newly built home with the bedroom upstairs if you are in your 60’s now and this is to be the last home you live in. To that I also go further and say you should also think about the size of lot you want to build on, or do you want a condo instead. Many seniors opt for a “patio home” which is usually a small one story home on a slab with a small lot so as to keep the yard upkeep manageable. You may find the best home and community until later realize you are spending $200+ month on landscaping costs because you built a home on a large lot and you can no longer do the landscaping yourself.
3.) Closet space – I know this probably applies to mostly woman and is likely the most obvious of the things to consider when picking out or designing a floor plan. If you can’t have your dream, gigantic closet as far as sq footage is concerned think about building the house with 9 ft ceilings and then you can have more room for two rows of hangers, and shelves without needing a lot of extra sq footage.
4.) Storage– Do you tend to collect and hold onto material things? Do you have a lot of family heirlooms? If this applies to you then you need to consider how much space is available for storage, and what unused space in the home can be converted to a storage space. Many home plans have tiny nooks here and there that can be fitted with a door and lined with plywood to make for extra storage space. But wait; how accessible is the storage space that is in the home? Meaning, are you going to have to squeeze in and out of closets, and walls to get to your storage spaces. You may want to consider having a floor plan that has storage in the main parts of the home and not just the attic or basement because if you need to access things you put into storage a lot it will get annoying to go up and down the stairs.
So.. If you are looking to build a new home in a developmentwith a large builder and pick one of their existing home plans, build your own custom home with a local home builder, or buy a house plan from the internet you need to really do your best to think long and hard about it, because you don’t want to be in a home you don’t enjoy everyday. Secondly, if you notice there are annoying things with your home layout there is a good chance that prospective buyers in the future will notice it too. A good real estate agent in Charleston, SCor wherever you are considering building should have this discussion with you so you don’t make the wrong choice.
Who’s to say what the nicest or best of anything as those terms are subjective, but I bring this article to you as my personal feelings as to what I feel is the nicest neighborhood in North Charleston. I have lived in the Charleston area since 1999, and there is no shortage of really nice communities here, but unfortunately the price of real estate can be out of the range of a lot folks because of it’s proximity to the beaches of Charleston, and historic downtown. Being a Charleston, SC real estate agent it’s my job to help people NOT from the area find the communities they might like to live, and it’s no mystery locally that North Charleston unfortunately has a stigma of being the “not so good” side of our beautiful town. If you aren’t from the area as many if you’ve moved here to work for such corporations like Boeing, Bosch, and Volvo just to name a few and have heard bad things about North Charleston let me first start by saying that North Charleston is a great area with many great neighborhoods, but one that I really like is Coosaw Creek. As a Realtor I will gladly help you, and show you homes throughout all of North Charleston, but I simply wrote this article as a to feature this particular gated community. So look out for other articles about other communities in the Low-country. To see schools in this area click HERE.
So for those who have to or want to live in North Charleston I am writing this post to share with you my personal favorite neighborhood in North Charleston. Let me explain why I call Coosaw Creek the nicest neighborhood in North Charleston. Coosaw Creek is a gated community located approximately 30 mins drive from downtown and about 40-45 mins drive to the beaches of Charleston, SC. Let me start by pointing out the features I love about this neighborhood:
– All the homes are on large well landscaped lots (which is hard to find in all of Charleston),
– Large mature trees
– Custom-built homes [Many of those homes are brick] – also which is hard to find afford-ably in Charleston.
– Gated
The best part of Coosaw Creek neighborhood is the country club. It features one of the nicest 18 hole golf courses in Charlestonwith a driving range, well manicured fairways, and greens, great course layout and upscale club house for dining, entertaining, and special events. The golf course has many ponds with many local species of fresh water fish such as large mouth bass, bluegill, and shell crackers to which children can be seen fishing. Local wild life can be seen all over the course as well such as herons, egrets, ibis, turtles and the occasional alligator. The Coosaw Creek community also has multiple hard court tennis facilities ready for the most accomplished players. So if you are relocating to our beautiful town we call Charleston and the north area is where you might be considering then give Coosaw Creek a look, because I think you too will like it as much as I do. If you’d like to see homes in Coosaw Creek search homes listings below and I’d be glad to show them to you. If you’d like to see other homes in other communities in North Charleston, SC see below. If the country club kind of neighborhood isn’t for you my other favorites I’d consider are: Eagle Landing, The Refuge at Whitehall,Cedar Grove,Ashborough East,Mateeba Estates&Indigo Fields .
Average price per square foot, and average sales price are the two largest indicators that both prospective buyers should look at as well as those considering selling their houses. If you are selling you want to make sure you’re trying to sell at the peak of the market, and if you’re a buyer vice versa, AND is the area you’re considering buying a good one? CHARLESTON, SC—(December 10, 2015) 1,029 homes sold in November in the region at a median price of $246,000 according to preliminary data released today by the Charleston Trident Association of Realtors® (CTAR). In November 2014, 987 homes sold at a median price of $222,067. Year-to-date data shows that sales volume is 14% ahead of where it was last year, with 14,758 sales through November 2015 and the regional median price has increased by 5.3%, currently $228,000. Through November 2014, 12,933 homes had sold at a median price of $216,352. Inventory has declined about 15% from 2014. There are currently 5,390 homes listed as “active” for sale in the Charleston Trident Multiple Listing Service (CTMLS).
Active Market Summary
Market Research Data
Here are current listing stats for Cities.
City
Min Price
Avg Price
Max Price
Min SQFT
Avg SQFT
Max SQFT
Min Built Year
Avg Built Year
Max Built Year
Total Amount
Daniel Island
$319,900
$2,292,967
$10,670,000
638
3,270
6,850
1997
2013
2026
89
Dewees Island
$26,000
$909,278
$3,499,000
0
1,382
4,560
1988
1997
2001
18
Bamberg
$15,000
$182,464
$398,500
0
1,350
3,000
1930
1975
2004
11
Charleston
$48,000
$958,152
$10,750,000
0
1,897
9,556
1700
1981
2026
2,519
Saint George
$9,600
$289,998
$2,078,800
0
964
3,530
1890
1977
2024
102
Harleyville
$20,000
$324,336
$1,485,000
0
1,329
3,160
1950
1997
2024
39
Huger
$64,900
$557,060
$1,740,000
0
2,015
4,073
1997
2022
2025
114
Seabrook Island
$69,000
$1,233,763
$5,900,000
0
1,879
6,633
1974
1990
2024
175
Moncks Corner
$7,500
$395,572
$8,800,000
0
1,894
6,725
1926
2022
8888
1,078
Ridgeville
$15,000
$581,248
$19,875,000
0
1,247
3,854
1952
2009
2025
177
Wadmalaw Island
$80,000
$1,126,592
$4,750,000
0
1,238
5,547
1957
2004
2024
48
Kiawah Island
$50,000
$2,316,148
$15,500,000
0
2,245
8,560
1976
1992
2024
119
Summerville
$32,000
$442,472
$10,000,000
0
2,105
5,779
1850
2014
2025
4,542
Cottageville
$29,000
$360,621
$1,850,000
0
830
5,497
1902
1992
2024
48
Ravenel
$25,000
$719,771
$5,625,000
0
1,861
4,721
1940
2017
2024
170
Johns Island
$40,000
$818,811
$6,499,000
0
1,990
9,943
1920
2012
2025
811
Folly Beach
$20,000
$1,277,967
$4,950,000
0
1,400
5,233
1933
1992
2025
133
Holly Hill
$18,900
$275,898
$1,125,000
0
1,250
3,248
1900
2013
2024
117
Cross
$16,000
$296,788
$3,800,000
0
777
2,839
1972
2008
2024
76
Walterboro
$4,000
$256,696
$6,768,000
0
1,040
4,534
1843
1982
2024
310
Isle of Palms
$75,500
$2,053,001
$11,865,750
0
2,078
6,999
1947
1990
2024
268
Yemassee
$30,000
$3,042,094
$39,500,000
0
1,429
6,000
1705
1951
2024
18
Mount Pleasant
$175,000
$1,214,273
$9,250,000
0
2,418
7,929
1860
2003
2025
1,630
Summerton
$12,950
$309,765
$1,495,000
0
1,314
5,300
1910
1990
2024
69
Hollywood
$16,000
$666,041
$7,999,000
0
1,443
8,679
1905
2003
2025
128
Jacksonboro
$150,000
$301,800
$550,000
0
334
1,670
1900
1900
1900
5
McClellanville
$60,000
$649,693
$4,400,000
0
999
4,217
1913
2006
2024
91
Hampton
$16,000
$157,339
$498,000
0
1,155
3,324
1950
1976
2024
28
Saint Stephen
$10,500
$181,476
$760,000
0
1,000
3,420
1940
2004
2024
92
Pineville
$10,000
$134,240
$350,000
0
705
2,432
1925
1988
2024
21
Bonneau
$8,990
$311,729
$1,400,000
0
1,260
4,176
1955
1998
2024
78
Goose Creek
$24,000
$336,333
$1,475,000
0
1,693
7,995
1958
1998
2024
688
Hodges
$75,000
$75,000
$75,000
0
0
0
1
Cope
$30,000
$620,880
$2,995,000
0
771
2,080
1970
1993
2022
10
Orangeburg
$7,800
$237,021
$1,375,000
0
1,409
4,531
1840
1991
2024
107
Reevesville
$11,500
$200,208
$509,000
0
856
2,280
1960
1987
2023
12
Branchville
$20,000
$178,613
$540,000
0
1,014
3,672
1940
1980
2008
15
Bowman
$20,000
$268,807
$1,450,000
0
764
2,160
1975
2001
2023
14
Dorchester
$60,000
$499,897
$4,000,000
0
1,217
3,258
1880
1989
2024
34
Adams Run
$15,000
$763,337
$10,500,000
0
679
6,502
1946
2001
2022
41
Wando
$185,000
$553,067
$4,500,000
0
1,404
4,172
1994
2016
2024
77
Aiken
$50,000
$786,143
$2,250,000
0
1,844
7,457
1937
1974
2015
7
Santee
$32,000
$313,224
$1,495,000
0
1,414
3,795
1930
2010
2024
96
Pawleys Island
$290,000
$921,734
$2,490,000
0
3,032
5,252
2005
2014
2020
7
North Charleston
$12,000
$371,775
$1,800,000
0
1,617
5,137
1919
1992
2024
1,175
Manning
$3,500
$264,633
$1,332,141
0
1,225
3,605
1939
1997
2024
111
Florence
$230,000
$318,967
$495,000
0
1,119
1,757
2004
2014
2023
3
Awendaw
$79,000
$888,351
$4,750,000
0
1,775
6,285
1952
2017
2025
158
Seabrook
$24,500
$296,843
$1,999,000
0
361
2,725
1982
2000
2009
28
Smoaks
$11,900
$172,739
$659,000
0
708
2,420
1940
1983
2023
18
Furman
$275,000
$275,000
$275,000
2,367
2,367
2,367
1880
1880
1880
1
Ridge Spring
$840,000
$6,500,000
$12,160,000
3,271
3,336
3,400
1989
1990
1991
2
Eutawville
$12,500
$253,952
$675,000
0
1,378
4,028
1828
1986
2024
60
Georgetown
$25,000
$352,352
$1,895,000
0
986
3,016
1945
1993
2024
25
Edisto Island
$49,000
$749,738
$4,987,500
0
1,058
10,712
1940
1994
2024
173
Jamestown
$39,000
$244,344
$650,000
0
694
1,744
1964
1989
2023
18
Sunset
$45,000
$45,000
$45,000
0
0
0
1
Landrum
$1,445,000
$1,445,000
$1,445,000
3,762
3,762
3,762
1950
1950
1950
1
Elloree
$12,000
$233,618
$564,500
0
1,199
3,226
1928
1992
2023
45
Pinopolis
$26,400
$561,530
$1,400,000
0
1,335
3,485
1953
1981
2016
10
Sullivans Island
$785,900
$5,048,061
$13,950,000
0
3,205
10,000
1895
1973
2025
64
Conway
$283,000
$325,966
$359,900
1,950
2,092
2,325
1989
2004
2017
3
Daufuskie Island
$27,900
$48,383
$69,250
0
0
0
3
Edisto Beach
$115,000
$677,526
$2,225,000
0
1,474
6,000
1950
1990
2017
43
Meggett
$132,000
$784,082
$7,000,000
0
1,108
4,800
1918
1992
2024
45
Hanahan
$65,000
$437,922
$1,199,999
0
1,961
4,432
1940
1996
2024
235
Ladson
$30,000
$337,065
$1,700,000
0
1,705
4,500
1961
1999
2024
367
Johnston
$289,900
$304,900
$319,900
2,099
2,154
2,209
1957
1975
1992
2
Bluffton
$220,000
$681,420
$2,250,000
0
1,857
3,255
2003
2010
2023
15
Ruffin
$11,500
$327,197
$2,495,000
0
1,017
4,478
1960
1990
2020
19
Beech Island
$58,392
$311,131
$780,000
0
1,491
4,472
2019
2019
2019
3
Islandton
$164,900
$316,114
$560,000
0
1,176
2,639
1980
1991
2001
6
Varnville
$35,000
$151,446
$229,000
0
1,268
2,472
1960
1986
2016
13
Saint Helena Island
$25,000
$434,073
$2,950,000
0
562
3,179
1980
1999
2015
26
Wagener
$108,000
$146,129
$315,000
0
0
0
12
Beaufort
$52,000
$722,625
$3,250,000
0
1,584
4,328
1810
1992
2024
69
Pinewood
$22,900
$87,300
$199,000
0
500
1,500
2020
2020
2020
3
Round O
$28,000
$302,544
$2,200,000
0
915
2,488
1948
2002
2024
34
Andrews
$49,999
$278,209
$700,000
0
660
2,171
1906
1970
2022
11
Sumter
$16,950
$223,891
$575,000
0
1,406
2,958
1953
1980
2019
16
West Columbia
$189,999
$283,500
$377,000
1,120
1,443
1,766
2000
2004
2008
2
Clover
$4,499,000
$4,499,000
$4,499,000
0
0
0
1
Edgefield
$258,000
$440,837
$1,299,900
1,360
2,218
4,000
1790
1992
2024
19
Hilton Head Island
$35,000
$346,067
$1,050,000
864
1,616
3,504
1979
1986
1994
9
Alcolu
$123,900
$123,900
$123,900
0
0
0
1
Monetta
$48,500
$115,475
$260,000
0
564
2,254
2023
2023
2023
4
Newberry
$55,000
$60,000
$65,000
1,304
1,372
1,441
1972
1972
1972
2
Spartanburg
$222,000
$310,950
$399,900
1,684
1,960
2,237
2006
2014
2021
2
Cordesville
$50,000
$337,213
$750,000
0
661
2,128
1956
1997
2020
11
Okatie
$459,900
$2,569,633
$6,450,000
1,712
4,358
8,362
1998
2009
2021
3
Lexington
$259,900
$354,225
$538,000
2,264
2,704
3,770
2010
2016
2020
4
Ridgeland
$124,000
$410,483
$1,350,000
0
1,448
5,600
1944
1979
2006
6
Williams
$40,000
$133,388
$210,650
0
919
1,760
1945
1981
1999
4
Allendale
$37,500
$95,800
$179,900
723
1,049
1,479
1950
1971
1990
3
Kingstree
$16,000
$287,368
$1,050,000
0
1,162
3,729
1925
1976
2022
19
Myrtle Beach
$192,500
$518,850
$1,790,000
581
1,504
3,866
1982
1996
2023
12
Cameron
$75,000
$365,733
$725,000
0
1,584
3,492
1893
1946
1976
6
Enoree
$275,000
$275,000
$275,000
0
0
0
1
Greenwood
$15,000
$15,000
$15,000
0
0
0
1
Saluda
$5,250,000
$5,250,000
$5,250,000
7,000
7,000
7,000
2006
2006
2006
1
Cordova
$115,000
$204,133
$349,900
780
1,922
3,664
1961
1972
1989
3
Saint Matthews
$32,900
$254,656
$1,154,160
0
414
2,245
1920
1948
1975
10
Rock Hill
$200,000
$282,500
$365,000
853
1,896
2,940
2005
2014
2023
2
Greeleyville
$29,000
$167,225
$319,900
0
1,330
3,082
1940
1968
1990
4
Murrells Inlet
$249,000
$640,580
$1,499,999
584
1,952
2,790
1965
1989
2013
5
Brunson
$135,000
$135,000
$135,000
1,503
1,503
1,503
2000
2000
2000
1
Chester
$624,750
$1,622,817
$2,620,884
0
0
0
2
Gaston
$4,204
$209,658
$257,900
1,125
1,648
2,075
1988
2018
2023
7
James Island
$275,000
$735,147
$1,325,000
0
1,763
4,172
1964
1998
2024
19
North
$25,000
$203,440
$918,810
0
0
0
9
Inman
$329,900
$329,900
$329,900
1,612
1,612
1,612
2023
2023
2023
1
Springfield
$21,000
$167,000
$425,000
0
507
1,522
1964
1964
1964
3
Early Branch
$139,000
$169,450
$199,900
1,216
1,459
1,702
1997
2010
2023
2
Vance
$149,900
$426,544
$1,250,000
1,000
1,665
2,537
1926
1971
2004
9
Williston
$11,750
$107,412
$578,000
0
142
1,987
1962
1962
1962
14
Blacksburg
$275,000
$275,000
$275,000
1,594
1,594
1,594
1995
1995
1995
1
Edgemoor
$2,250,000
$2,250,000
$2,250,000
0
0
0
1
Greenville
$320,000
$320,000
$320,000
2,265
2,265
2,265
1999
1999
1999
1
Ehrhardt
$79,000
$214,350
$349,700
1,200
2,205
3,210
1975
1975
1975
2
Green Pond
$22,668
$321,517
$1,249,000
0
423
2,280
1990
2009
2021
10
Neeses
$50,000
$273,000
$549,000
0
990
1,563
1994
1995
1995
3
Ridgeway
$2,518,560
$2,518,560
$2,518,560
0
0
0
1
Eastover
$80,000
$80,000
$80,000
0
0
0
1
Estill
$59,999
$191,225
$450,000
1,464
2,539
5,218
1934
1968
1988
4
Hemingway
$90,000
$90,000
$90,000
1,350
1,350
1,350
1998
1998
1998
1
Fairfax
$79,900
$122,633
$199,000
912
1,204
1,500
1966
1976
1985
3
Barnwell
$25,000
$275,490
$750,000
0
1,875
3,500
1978
2001
2014
5
Salters
$23,950
$315,633
$899,000
0
0
0
3
Shulerville
$139,500
$179,850
$285,000
0
456
1,824
2007
2007
2007
4
Edisto
$142,500
$228,700
$314,900
0
354
709
1980
1980
1980
2
Alvin
$35,000
$73,457
$154,900
0
0
0
4
Sheldon
$25,000
$25,000
$25,000
0
0
0
1
Leesville
$540,000
$540,000
$540,000
2,328
2,328
2,328
1992
1992
1992
1
Columbia
$38,000
$289,613
$927,000
0
1,348
2,905
1911
1969
2012
16
Norway
$158,900
$279,450
$400,000
2,215
2,216
2,216
1948
1977
2005
2
Marion
$37,000
$230,950
$424,900
0
1,561
3,122
1950
1950
1950
2
Irmo
$117,500
$817,500
$1,790,000
1,436
3,002
4,113
1978
1990
1999
3
Prosperity
$49,990
$626,330
$1,150,000
0
1,632
3,098
1989
2006
2023
3
Elgin
$280,000
$465,000
$650,000
2,100
3,166
4,231
2018
2020
2021
2
Winnsboro
$144,500
$155,125
$165,750
0
0
0
2
Simpsonville
$99,999
$99,999
$99,999
0
0
0
1
Olar
$149,000
$149,000
$149,000
0
0
0
1
North Myrtle Beach
$198,000
$363,950
$529,900
630
1,378
2,127
1997
2009
2020
2
Belton
$159,900
$159,900
$159,900
1,275
1,275
1,275
1970
1970
1970
1
Port Royal
$325,000
$325,000
$325,000
1,275
1,275
1,275
1989
1989
1989
1
Eutaw Springs
$75,000
$75,000
$75,000
0
0
0
1
Pendleton
$4,495,000
$4,495,000
$4,495,000
0
0
0
1
Fort Mill
$414,999
$414,999
$414,999
0
0
0
1
Hardeeville
$160,000
$364,500
$569,000
0
1,375
2,750
2020
2020
2020
2
Hopkins
$775,000
$775,000
$775,000
3,291
3,291
3,291
1983
1983
1983
1
Lodge
$23,000
$225,833
$550,000
0
601
1,804
1961
1961
1961
3
Coosawhatchie
$175,000
$175,000
$175,000
0
0
0
1
Rowesville
$179,000
$239,450
$299,900
1,526
1,609
1,692
1960
1984
2007
2
Travelers Rest
$45,000
$45,000
$45,000
0
0
0
1
Sycamore
$20,000
$20,000
$20,000
0
0
0
1
Pamplico
$278,000
$278,000
$278,000
1,698
1,698
1,698
2022
2022
2022
1
Grays
$195,000
$195,000
$195,000
0
0
0
1
Blackstock
$1,200,000
$1,200,000
$1,200,000
3,140
3,140
3,140
2006
2006
2006
1
Blackville
$88,999
$88,999
$88,999
3,000
3,000
3,000
2000
2000
2000
1
Denmark
$75,000
$151,980
$225,000
1,000
1,646
2,026
1963
1981
2016
5
Abeville
$50,000
$50,000
$50,000
1,300
1,300
1,300
1960
1960
1960
1
Westminster
$154,900
$161,200
$165,000
954
957
960
1986
1989
1990
4
Olanta
$339,000
$339,000
$339,000
2,688
2,688
2,688
1925
1925
1925
1
Salley
$449,000
$449,000
$449,000
0
0
0
1
Easley
$249,899
$249,899
$249,899
1,344
1,344
1,344
1972
1972
1972
1
Lane
$299,999
$299,999
$299,999
2,059
2,059
2,059
2017
2017
2017
1
Camden
$1,090,000
$1,095,000
$1,100,000
2,970
3,951
4,932
1771
1889
2007
2
Fort Motte
$50,000
$50,000
$50,000
0
0
0
1
Lugoff
$180,000
$180,000
$180,000
0
0
0
1
Chapin
$1,430,000
$1,430,000
$1,430,000
4,565
4,565
4,565
2004
2004
2004
1
Lincolnville
$408,935
$449,171
$512,265
1,749
2,384
3,129
2024
2024
2024
5
New Zion
$445,000
$445,000
$445,000
1,800
1,800
1,800
2007
2007
2007
1
Jonesville
$299,999
$299,999
$299,999
2,247
2,247
2,247
1972
1972
1972
1
Windsor
$52,050
$52,050
$52,050
0
0
0
1
Cassatt
$280,963
$571,347
$936,600
0
0
0
7
Westville
$136,800
$136,800
$136,800
0
0
0
1
Bethune
$70,850
$372,914
$864,400
0
0
0
14
Ladys Island
$1,595,000
$1,595,000
$1,595,000
2,100
2,100
2,100
1989
1989
1989
1
York
$225,000
$225,000
$225,000
1,310
1,310
1,310
1967
1967
1967
1
Here are current listing stats for Condos.
Subdivision
min Price
Avg Price
Max Price
Min SQFT
Avg SQFT
Max SQFT
Min Built Year
Avg Built Year
Max Built Year
Total Amount
Villas at Charleston Park
$335,000
$335,000
$335,000
1,600
1,600
1,600
2009
2009
2009
1
Elliotborough
$779,000
$779,000
$779,000
1,310
1,310
1,310
2005
2005
2005
1
Harleston Village
$3,695,000
$3,695,000
$3,695,000
5,500
5,500
5,500
1816
1816
1816
1
Carolina Park
$670,000
$670,000
$670,000
1,665
1,665
1,665
2021
2021
2021
1
Cannonborough-Elliotborough
$2,275,000
$2,275,000
$2,275,000
2,175
2,175
2,175
2024
2024
2024
1
Here are current listing stats for Subdivisions.
Subdivision
Min Price
Avg Price
Max Price
Min SQFT
Avg SQFT
Max SQFT
Min Built Year
Avg Built Year
Max Built Year
Total Amount
Daniel Island
$319,900
$1,882,758
$10,670,000
0
2,703
6,850
1997
2013
2026
153
Dewees Island
$26,000
$909,278
$3,499,000
0
1,382
4,560
1988
1997
2001
18
Seabrook Island
$210,000
$1,344,255
$5,900,000
0
2,026
6,633
1974
1990
2024
145
Timothy Lakes
$354,900
$420,082
$499,395
1,867
2,426
3,055
2022
2024
2025
23
Wando Village
$651,390
$1,350,029
$2,669,640
2,329
2,930
3,417
2023
2023
2024
25
Longcreek Plantation
$999,000
$2,424,500
$3,850,000
3,075
4,170
5,266
1994
1995
1996
2
French Quarter
$799,000
$2,564,420
$4,500,000
858
2,029
3,834
1794
1986
2024
32
Foxbank Plantation
$288,000
$404,903
$588,276
1,177
2,408
3,839
2006
2021
2024
191
Kiawah Island
$50,000
$2,480,576
$15,500,000
0
2,210
8,560
1976
1990
2024
74
Hampton Woods
$254,990
$309,093
$467,500
1,304
1,762
2,740
2018
2024
2024
96
Briars Creek
$295,000
$1,818,885
$6,499,000
0
1,975
9,286
2005
2017
2024
13
Oak Bluff
$205,000
$535,596
$974,000
998
1,967
3,003
2002
2018
2024
75
Tabby Island
$200,000
$200,000
$200,000
0
0
0
1
Wadmalaw Island
$80,000
$374,833
$850,000
0
0
0
6
Kitfield Westend Mitton Road
$40,000
$133,069
$239,000
0
586
1,812
1950
1976
2005
8
Sheep Island
$60,000
$470,613
$1,900,000
0
420
1,863
1993
1999
2004
8
Lebanon Area
$90,000
$2,125,539
$19,875,000
0
747
2,786
1980
2005
2025
21
Country Estates
$19,000
$327,225
$799,000
0
1,752
4,306
2022
2023
2023
4
Beresford Hall
$475,000
$2,582,167
$6,895,000
0
3,507
8,500
2004
2011
2022
12
Woodville
$575,000
$2,662,500
$4,750,000
0
712
1,425
1991
1991
1991
2
Broughton Road
$199,000
$481,333
$785,000
0
1,698
3,077
1998
1999
2000
3
Rockville
$320,000
$320,000
$320,000
0
0
0
1
Hollywood
$80,000
$499,172
$1,700,000
0
930
3,700
1947
1995
2025
19
Cross Area (East)
$30,000
$593,807
$5,250,000
0
1,067
3,078
1976
1999
2024
14
St Stephen
$20,000
$139,068
$525,000
0
591
3,420
1955
1995
2023
22
Russellville
$18,990
$222,529
$575,000
0
1,434
3,300
1967
2006
2024
17
Rural Northern Berkeley County
$18,990
$139,189
$350,000
0
288
1,536
1970
1997
2024
10
Bonneau
$8,990
$201,284
$899,000
0
1,030
4,176
1970
1999
2024
7
Kiawah River Estates
$299,900
$1,315,957
$2,950,000
0
2,537
3,781
1999
2012
2024
21
St James Santee Parish
$225,000
$225,000
$225,000
0
0
0
1
Old Moncks Corner
$90,000
$140,000
$190,000
0
0
0
2
Azalea Estates
$185,000
$187,450
$189,900
0
532
1,064
2023
2023
2023
2
Hidden Hills
$135,000
$287,500
$440,000
0
1,133
2,266
2014
2014
2014
2
Poplar Grove
$179,000
$1,214,049
$2,847,000
0
2,029
4,721
2006
2018
2024
39
Phillips
$315,000
$3,190,750
$7,550,000
0
0
0
4
Legend Oaks Plantation
$149,900
$451,461
$725,000
0
2,323
3,824
1995
2004
2017
57
Chapel Creek Plantation
$32,000
$290,771
$460,000
0
1,569
2,800
1991
2016
2024
7
Francis Marion
$85,000
$583,725
$1,450,000
1,336
2,502
5,300
1974
1992
2006
4
Chicora Place
$75,000
$239,836
$700,000
0
839
2,442
1921
1946
1997
14
Daniel Island Park
$1,850,000
$3,636,523
$8,500,000
0
4,628
9,556
2002
2011
2024
44
Pine Forest Plantation
$231,900
$231,900
$231,900
1,757
1,757
1,757
2004
2004
2004
1
Cane Bay Plantation
$99,000
$446,884
$1,449,000
0
2,341
4,408
2007
2021
2024
1,005
Carolina Park
$600,000
$1,424,838
$3,062,213
0
3,116
4,943
2013
2021
2025
150
Paradise Island
$450,000
$1,427,010
$2,595,000
0
2,807
4,298
2005
2018
2025
10
Hewing Farms
$460,470
$575,556
$667,285
1,908
3,048
4,182
2022
2024
2025
49
Bowen Island
$789,000
$789,000
$789,000
0
0
0
1
Rushland Plantation
$295,000
$1,361,883
$2,975,000
0
2,495
3,884
2004
2017
2024
8
The Preserve at Fenwick Plantation
$260,000
$1,359,939
$1,825,000
0
2,667
3,444
2015
2023
2025
18
Woodland Terrace
$275,000
$344,893
$449,680
1,358
2,145
3,212
1959
1981
2022
3
Mayfield Terrace
$164,900
$243,300
$320,000
1,340
1,621
2,022
1958
1981
2024
3
Forest Hills
$6,500
$246,703
$509,000
0
1,323
2,644
1950
1973
1997
35
Liberty Hill Farm
$748,060
$1,181,373
$2,130,480
2,111
2,949
3,481
2021
2023
2024
71
Petterson Meadows
$304,360
$375,147
$469,000
1,548
2,303
3,392
2021
2023
2024
82
Park West
$299,999
$842,114
$4,295,000
662
2,320
6,428
2000
2006
2024
128
Heirloom Landing
$575,000
$1,716,483
$2,150,000
0
2,635
3,745
2022
2024
2025
6
Browders Field
$338,000
$338,000
$338,000
0
0
0
1
Kiawah River
$360,000
$1,499,123
$5,399,000
0
1,954
4,400
2019
2022
2024
31
Highways 17-A / Old 52 / New 52
$30,000
$501,088
$2,000,000
0
1,057
2,270
1974
2002
2024
17
French Quarter Creek
$450,000
$569,157
$691,895
1,794
2,487
3,390
2022
2023
2024
33
Blossom Village
$160,900
$160,900
$160,900
1,193
1,193
1,193
1970
1970
1970
1
Point Hope
$642,740
$892,680
$1,199,000
2,078
2,703
3,600
2023
2024
2024
19
The Point
$160,000
$420,000
$1,055,000
0
0
0
5
Oaks Estates
$82,900
$296,380
$390,000
0
1,410
1,968
1965
1969
1975
5
Nexton
$289,990
$544,956
$1,147,396
1,046
2,154
3,771
2016
2023
2025
474
Romain Retreat
$370,000
$824,750
$1,500,000
0
1,608
3,794
1991
1998
2004
4
The Retreat at Brownswood
$599,990
$693,834
$784,990
2,097
2,629
3,333
2022
2023
2024
7
Ten Mile
$565,000
$565,000
$565,000
3,376
3,376
3,376
1975
1975
1975
1
Johns Island
$150,000
$819,081
$4,898,000
0
1,319
5,404
1958
2016
2024
35
Sunset Cay Marina
$54,000
$61,223
$70,000
0
0
0
1999
2003
2006
13
Oaks Preserve
$1,999,999
$2,750,000
$3,500,000
0
0
0
2
Palmetto Fort
$1,100,000
$1,379,783
$1,579,132
2,383
3,124
3,745
1962
2006
2023
4
Ripley Cove
$850,000
$855,000
$860,000
1,985
2,018
2,050
2006
2006
2006
2
Ridgeville
$252,000
$310,000
$368,000
0
522
1,044
1999
1999
1999
2
Windsor Crossing
$329,990
$397,268
$468,895
1,499
2,142
3,119
2002
2024
2024
127
Center Pointe
$242,155
$272,132
$324,273
1,183
1,456
2,209
2022
2023
2024
30
E Folly Bch Shores
$949,999
$1,070,000
$1,280,000
0
565
912
1969
1975
1981
3
The Oaks
$384,900
$501,164
$635,990
1,500
2,638
3,236
1979
2021
2024
17
Oakley Pointe
$315,990
$429,799
$604,680
1,828
2,615
3,435
2013
2023
2024
20
Cannonborough-Elliotborough
$499,000
$1,647,150
$3,228,000
0
1,619
3,450
1814
1954
2026
40
Fountain Lake
$79,900
$294,580
$575,000
0
1,228
2,400
1967
1992
2023
5
Six Oaks
$299,900
$378,302
$515,435
1,548
2,036
2,950
2023
2024
2025
74
Grace Landing
$556,790
$690,713
$865,000
1,858
2,483
3,245
2022
2024
2024
27
Kings River Preserve
$629,000
$674,495
$719,990
2,649
2,798
2,948
2023
2023
2023
2
Abbey Walk
$394,990
$401,995
$409,000
2,471
2,472
2,474
2023
2023
2023
2
South Island Plantation
$45,000
$452,333
$663,000
0
1,729
2,746
2023
2023
2023
3
The Overlook at Copahee Sound
$954,460
$1,136,045
$1,372,828
2,413
3,061
3,472
2024
2024
2024
11
Boykins Run
$289,533
$310,545
$370,990
1,600
1,674
2,300
2023
2023
2024
19
Dunes West
$384,900
$1,145,455
$4,950,000
0
2,940
7,929
1992
2007
2025
131
The Settlement
$375,000
$1,141,386
$1,520,796
0
2,110
3,739
2021
2024
2024
19
Katy Hill Plant
$820,000
$820,000
$820,000
0
0
0
1
Bohicket Marina
$69,000
$88,800
$109,000
0
419
720
1981
2001
2005
8
Huger
$64,900
$167,388
$664,750
0
0
0
12
Isle of Palms
$269,000
$3,207,143
$11,800,000
0
3,089
6,999
1947
1993
2023
35
Covenant Preserve
$889,000
$889,000
$889,000
3,100
3,100
3,100
2023
2023
2023
1
Shadowmoss
$290,000
$521,468
$909,000
1,300
2,078
3,896
1977
2000
2025
49
Edisto Oaks
$119,700
$188,775
$475,000
0
180
1,440
2023
2023
2023
8
The Harborage at Ashley Marina
$95,000
$168,822
$499,500
0
283
900
1989
1998
2005
9
Summerville Estates
$89,900
$272,360
$499,900
0
726
1,865
2006
2007
2007
5
City of Charleston
$185,000
$1,896,760
$4,186,200
0
1,666
2,932
1885
2008
2026
25
The Park at Rivers Edge
$150,000
$289,571
$750,000
0
1,338
2,144
1984
2002
2023
51
Cross Area (West)
$28,000
$255,648
$2,018,200
0
661
2,001
1980
2011
2024
20
South Pointe Estates
$425,000
$526,876
$584,900
2,501
2,919
3,326
2018
2021
2023
5
Cypress Preserve
$304,949
$377,518
$475,000
1,420
2,283
3,510
2021
2024
2024
110
Mt Pleasant Hgts
$2,300,000
$2,300,000
$2,300,000
3,011
3,011
3,011
2023
2023
2023
1
Hayes Park
$589,990
$655,589
$714,500
1,870
2,116
2,431
2023
2023
2024
10
Watson View
$708,015
$767,366
$862,337
2,586
3,194
3,785
2024
2024
2024
11
Enclave at Copahee Sound
$799,486
$906,516
$1,001,142
2,856
3,383
3,785
2024
2024
2024
10
Macedonia
$70,000
$194,399
$400,000
0
748
2,024
1963
1988
2001
10
Pinopolis Road To Dehayville
$259,000
$675,600
$1,400,000
0
1,278
3,485
1984
2003
2024
5
Sullivans Island
$899,000
$5,588,675
$13,950,000
0
3,671
10,000
1901
1975
2025
40
Summers Corner
$265,465
$403,610
$785,000
1,303
2,371
4,386
2016
2024
2024
587
Menstone Park
$399,000
$499,450
$599,900
1,495
1,980
2,464
1979
1980
1980
2
Ballards Pointe
$225,000
$244,750
$275,000
1,232
1,306
1,526
2005
2005
2005
4
Summerset Acres
$79,900
$344,650
$600,000
0
1,340
2,362
1978
1990
2004
6
Bull Point
$35,000
$224,253
$959,900
0
153
2,302
2008
2008
2008
15
The Crescent
$1,395,000
$4,989,000
$6,990,000
0
5,171
8,636
1952
1987
2023
5
Bonneau Estates
$150,000
$168,750
$220,000
0
812
1,344
1996
2005
2022
4
The Ponds
$110,000
$503,129
$765,000
0
2,456
4,541
2009
2020
2024
100
Crystal Harbor
$550,000
$1,383,725
$2,975,000
0
2,502
5,956
2008
2016
2024
4
Headquarters Plantation
$399,000
$1,623,273
$3,800,000
0
3,018
4,551
1993
2009
2022
11
Bermuda Pointe Towns
$299,900
$314,400
$349,900
955
991
995
2024
2024
2024
10
Little Oak Island
$489,000
$1,245,725
$3,380,400
1,098
1,716
3,319
1982
1990
2013
8
Edisto Beach
$255,000
$1,078,382
$2,225,000
0
1,986
5,341
1940
1994
2024
28
Wassamassaw Plantation
$100,000
$352,025
$1,300,000
0
686
4,509
2015
2017
2019
12
Historic District
$92,000
$751,362
$2,499,900
0
2,305
5,779
1870
1938
2007
34
Union Heights
$79,500
$213,307
$445,000
0
646
1,911
1940
2004
2024
21
Tibwin Farms
$499,000
$2,331,333
$4,400,000
0
2,500
4,141
2001
2013
2024
3
Waters Edge
$89,900
$588,870
$999,999
0
1,487
2,526
1992
1999
2021
10
Deercreek Plantation
$215,000
$297,218
$339,900
1,100
1,729
2,406
2002
2019
2024
17
17-A From Hwy 6 To Hwy 52
$19,900
$498,300
$1,400,000
0
0
0
3
Ion
$1,350,000
$2,693,340
$4,550,000
1,625
3,626
7,106
1999
2006
2021
35
Gift Plantation
$324,999
$1,279,312
$2,300,000
0
4,158
7,763
1993
2004
2024
8
Riverside
$700,000
$1,025,000
$1,350,000
2,118
2,643
3,168
1987
2001
2015
2
Pineland Village
$499,000
$563,920
$620,345
1,909
2,480
2,754
2023
2024
2024
15
Santee Cooper Resort
$178,000
$468,435
$773,000
0
2,362
3,795
1973
1994
2024
17
Jenkins Point Plantation
$74,500
$123,080
$199,000
0
0
0
5
Middleton Place
$146,900
$539,933
$1,250,000
0
1,170
3,511
1999
1999
1999
3
Fifteen Mile
$84,900
$142,400
$199,900
0
0
0
2
Landings at Sweetwater
$700,000
$799,491
$869,990
2,109
2,858
3,333
2020
2023
2024
8
Watson Hill
$302,990
$425,615
$566,990
1,200
2,300
3,402
2022
2023
2024
67
Jericho On The Ashley
$12,000
$16,000
$20,000
0
0
0
2
Otranto
$325,000
$493,600
$799,000
1,592
2,527
3,585
1969
1981
2003
13
Washington Park
$185,000
$347,500
$510,000
0
772
1,543
1949
1949
1949
2
Homecoming
$324,900
$446,326
$559,000
1,686
2,530
3,969
2022
2023
2024
31
Alston Point
$525,000
$1,131,459
$2,992,000
0
821
3,703
2000
2010
2024
11
Jungle Shores
$319,000
$813,929
$1,600,000
0
1,488
2,838
1997
2013
2024
7
Wescott Plantation
$260,000
$371,920
$498,000
1,115
2,076
3,300
2001
2009
2024
133
Bennetts Bluff
$949,000
$1,214,227
$1,399,000
1,908
2,736
3,470
2020
2022
2024
11
Creek Watch Villas
$535,000
$617,000
$699,000
1,026
1,129
1,232
1981
1982
1983
2
Oaklawn
$214,000
$257,000
$300,000
918
1,269
1,620
1958
1990
2022
2
South of Broad
$615,000
$3,377,919
$10,750,000
525
3,156
7,838
1700
1864
2024
62
Pine Crest
$339,900
$339,900
$339,900
1,762
1,762
1,762
2023
2023
2023
1
Yellow House Place
$185,000
$227,500
$270,000
0
0
0
2
Noisette Row
$429,900
$463,567
$534,900
2,175
2,395
2,532
2022
2022
2022
15
The Summit
$539,000
$826,278
$1,250,000
1,941
3,614
5,460
2001
2014
2021
9
Centerville
$307,000
$558,583
$785,000
1,050
1,448
2,418
1956
1959
1961
6
Midland Park
$195,000
$227,780
$279,900
864
1,188
1,458
1931
1959
1986
5
Rushland
$509,999
$988,000
$1,800,000
0
2,307
3,455
1920
1997
2023
6
Harris Town
$15,000
$15,000
$15,000
0
0
0
1
Christ Church Parish
$325,000
$862,363
$2,950,000
0
1,387
3,201
2004
2014
2024
8
Turtle Point
$220,000
$392,500
$565,000
0
0
0
2
Summers Bend on the Ashley
$256,000
$305,008
$384,990
1,415
1,518
1,842
2007
2016
2024
30
Awendaw
$100,000
$481,438
$2,250,000
0
919
3,098
1969
2006
2024
13
Pinehill Acres
$35,000
$279,418
$409,000
0
1,524
2,750
1979
2010
2024
25
Camelot Village
$273,600
$321,120
$355,000
1,100
1,611
2,065
1966
1980
2001
5
Limehouse Villas
$255,000
$304,207
$365,000
1,360
1,657
2,366
2004
2010
2016
7
Schieveling Plantation
$170,000
$485,975
$575,000
0
1,714
2,520
2002
2003
2005
8
Awendaw Lakes
$677,355
$736,207
$843,020
1,907
2,336
2,750
2023
2023
2024
8
Sunburst Lakes
$299,900
$340,467
$385,000
1,287
1,799
2,344
2000
2001
2003
6
Wild Dunes Yacht Harbor
$295,000
$327,500
$360,000
0
0
0
1990
1990
1990
2
Oceanside
$575,000
$617,967
$679,000
960
960
960
1981
1981
1981
3
Townes at Merrimack
$259,000
$288,844
$334,900
1,554
1,632
1,693
2023
2024
2024
55
E Peurifoy Terrace
$189,000
$189,000
$189,000
1,060
1,060
1,060
1971
1971
1971
1
Legare Creek Plantation
$325,000
$366,667
$450,000
0
0
0
3
Sawyers Landing
$975,000
$1,025,000
$1,075,000
2,138
2,428
2,717
2010
2010
2010
2
Frierson Park
$320,000
$513,333
$695,000
976
2,366
3,432
1950
1961
1968
3
Riverland Terrace
$598,000
$1,091,792
$1,900,000
1,050
2,114
4,482
1940
1961
2024
22
Coopers Bluff
$387,990
$404,202
$440,840
2,100
2,148
2,255
2023
2023
2023
13
Harleston Village
$439,000
$1,851,610
$4,635,000
0
2,455
6,600
1809
1916
2024
67
Twin Rivers Towns
$344,900
$367,483
$384,900
1,055
1,195
1,276
2024
2024
2024
30
Beehive Plantation
$220,000
$347,475
$729,900
0
612
2,450
2023
2023
2023
4
Jeremy Cay
$150,000
$1,625,340
$4,987,500
0
3,266
10,712
1994
2004
2021
10
Edisto Island
$143,000
$339,000
$465,000
0
687
1,810
1960
1982
2021
7
Forest Edge
$508,045
$667,830
$835,900
1,904
2,757
3,807
2022
2024
2025
18
Anchorage Plantation
$299,000
$2,319,500
$4,750,000
0
2,331
5,547
2018
2020
2021
6
Ravens Run
$1,550,000
$2,527,333
$3,495,000
3,054
4,002
5,938
1986
1993
2000
6
Tranquil Estates
$30,000
$224,167
$335,000
0
954
1,726
1975
1978
1979
6
Sterling Oaks
$490,000
$548,750
$610,000
2,501
2,922
3,140
1987
2000
2023
4
The Timbers
$448,000
$536,500
$625,000
2,333
2,354
2,374
1994
2006
2018
2
Twin Lakes
$89,000
$504,592
$1,550,000
0
1,565
3,003
1997
2020
2024
29
McCords Ferry at Lake Marion
$436,254
$456,438
$469,900
2,632
2,836
3,226
2006
2019
2023
5
Cordesville Area
$45,000
$452,586
$1,632,999
0
1,394
6,725
1940
1992
2024
19
Oakdale Estates
$259,900
$294,933
$364,900
1,088
1,316
1,454
1968
1968
1968
3
Carnes Crossroads
$384,900
$511,460
$699,900
1,442
2,524
3,457
2013
2023
2024
128
Forest Trail
$1,175,000
$2,364,875
$4,500,000
1,258
2,740
4,232
1972
1994
2023
8
Limehouse Village
$355,160
$417,373
$498,865
1,591
2,637
3,565
2019
2023
2024
72
Ravenwood
$115,000
$205,000
$295,000
0
0
0
2
St. Thomas Island
$435,000
$878,333
$1,250,000
0
0
0
3
Hopkinson
$90,000
$606,267
$1,200,000
0
800
2,400
1985
1985
1985
3
Wyboo Plantation
$3,500
$261,832
$948,000
0
1,186
3,605
1997
2005
2023
25
Pine Hill
$215,000
$341,998
$495,000
1,344
2,249
3,820
1979
2004
2024
5
Moncks Corner
$23,900
$1,105,948
$2,640,000
0
513
2,051
2002
2002
2002
4
Elrod Estates
$599,900
$599,900
$599,900
2,432
2,432
2,432
1977
1977
1977
1
Harts Bluff
$355,000
$535,000
$715,000
1,700
2,416
3,133
1990
1990
1990
2
Fenwick Hall
$1,290,000
$1,290,000
$1,290,000
0
0
0
1
Sherwood Forest
$369,900
$429,223
$560,000
948
1,628
3,129
1955
1968
1984
6
Pine Forest Country Club
$355,000
$489,870
$793,250
1,524
2,456
4,000
1990
2002
2018
33
The Preserve at The Clam Farm
$779,999
$840,000
$900,000
2,206
2,446
2,686
2014
2016
2017
2
Carolina Terrace
$639,000
$871,843
$1,095,000
1,132
1,940
2,690
1938
1968
2023
7
Greystone
$375,000
$375,000
$375,000
1,365
1,365
1,365
1983
1983
1983
1
Bridal Gate at Bulls Bay Landing
$340,000
$1,470,000
$1,995,000
0
2,313
3,200
2005
2017
2024
4
Stono Shores
$250,000
$779,500
$1,500,000
0
1,601
3,936
1958
1976
2004
4
Landings at Montague
$269,900
$316,065
$342,800
1,452
1,648
1,800
2019
2023
2024
24
Oakwood Estates
$599,500
$599,500
$599,500
2,291
2,291
2,291
2020
2020
2020
1
Ansonborough
$409,900
$2,368,096
$6,150,000
457
2,275
6,511
1807
1904
2025
34
Betsy Field
$4,500,000
$4,500,000
$4,500,000
0
0
0
1
Snee Farm
$350,000
$1,080,648
$2,050,000
1,219
2,359
4,312
1975
1986
2021
35
Crowfield Plantation
$193,000
$448,636
$1,350,000
917
2,270
7,995
1980
1993
2022
126
Adams Run
$85,000
$292,375
$500,000
0
483
1,931
1905
1905
1905
4
Pineview Terrace
$240,000
$278,750
$310,000
984
1,461
1,726
1960
1967
1976
4
Avenue of Oaks
$179,000
$576,264
$1,270,000
913
1,510
2,474
1986
2005
2022
11
Encampment Plantation
$580,000
$580,000
$580,000
1,664
1,664
1,664
2008
2008
2008
1
Woodlands
$335,000
$440,840
$535,000
1,182
1,565
2,337
1996
2005
2014
10
Grand Oaks Preserve
$246,000
$254,896
$265,000
1,540
1,599
1,685
2006
2006
2007
13
Back Bay at Folly
$899,000
$899,000
$899,000
1,640
1,640
1,640
2007
2007
2007
1
Sea Island Preserve
$535,340
$749,679
$996,000
1,763
2,825
3,800
2022
2024
2024
44
Hilton Head Island
$40,000
$420,950
$699,000
1,247
1,620
1,807
1983
1987
1994
4
Ashborough
$238,090
$525,389
$1,000,000
1,144
2,624
5,400
1970
1978
1993
23
Sea Cabin On The Ocean
$550,000
$594,967
$679,900
490
490
490
1980
1980
1980
3
Hickory Hill Plantation
$475,000
$530,800
$705,000
2,011
2,437
3,188
1975
1978
1981
5
Manning
$45,000
$88,750
$185,000
0
938
2,243
1961
1969
1976
4
Limehouse
$350,960
$385,248
$499,000
1,591
2,286
2,928
2016
2022
2024
12
Meadowbrook
$229,000
$289,500
$330,000
990
1,419
2,564
1968
1977
1996
9
Sheldon
$109,900
$109,900
$109,900
0
0
0
1
Eastside
$285,000
$787,144
$1,075,000
0
1,572
2,850
1852
1928
2024
17
Whitehall Terrace
$175,000
$247,625
$410,000
0
250
1,000
1977
1977
1977
4
Liberty Village
$335,000
$389,599
$443,777
1,173
2,239
3,267
2009
2017
2020
27
LongLeaf
$23,500
$362,918
$1,795,000
0
1,733
2,796
1963
2005
2024
28
Yonges Island
$450,000
$791,750
$1,499,000
0
392
1,568
2020
2020
2020
4
Stone Ridge
$350,000
$399,800
$469,900
1,460
2,182
3,214
2021
2023
2023
6
Summer Wood
$225,000
$260,863
$305,000
1,088
1,396
1,836
2002
2006
2016
22
Horseshoe
$12,000
$174,256
$430,000
0
335
1,481
1977
1997
2012
9
Pinefield
$199,995
$1,067,359
$2,299,000
0
1,243
3,392
2004
2010
2015
5
Coosaw Creek Country Club
$519,900
$707,091
$1,050,000
2,143
3,425
5,137
1992
2002
2024
32
Big Paradise Island
$750,000
$1,236,667
$2,195,000
0
1,216
3,648
2012
2012
2012
3
Seaside Farms
$725,000
$1,137,035
$2,075,000
0
2,296
3,325
1999
2003
2015
23
Charleston Farms
$45,000
$315,373
$485,000
0
1,205
2,646
1936
1974
2024
37
Sedgefield
$249,000
$303,169
$339,900
1,080
1,348
1,625
1963
1971
1976
10
Mckewn
$298,999
$367,873
$459,987
1,167
1,966
3,132
2009
2017
2020
38
North Central
$399,000
$925,279
$1,599,900
0
1,575
2,954
1915
1931
1965
28
Irongate
$349,000
$425,195
$550,000
1,616
2,088
2,879
1979
1986
1998
15
Oyster Point
$749,900
$1,248,608
$2,990,000
1,695
2,783
4,212
2015
2018
2022
24
Wando Woods
$310,000
$659,574
$1,800,000
0
1,655
3,128
1956
1976
2008
19
Bridges at Seven Lakes
$564,999
$795,349
$1,095,000
1,786
2,699
4,073
2018
2020
2021
15
Carolina Groves
$284,900
$350,204
$425,565
1,183
1,680
2,361
2023
2024
2024
123
Sandhurst
$559,000
$821,990
$1,395,000
1,582
2,361
4,005
1961
1966
1986
10
Pavillion Watch
$895,000
$895,000
$895,000
1,352
1,352
1,352
2004
2004
2004
1
Sylvan Acres
$850,000
$850,000
$850,000
2,933
2,933
2,933
1996
1996
1996
1
Egret/Pintail
$579,000
$2,363,800
$3,300,000
0
3,492
5,105
1986
1995
2004
5
Fort Johnson Estates
$675,000
$878,988
$1,345,900
0
1,852
2,890
1958
1964
1971
8
Indigo Palms
$332,000
$417,324
$489,000
1,484
2,534
3,169
2006
2011
2016
12
Ashley Marina
$75,000
$75,000
$75,000
0
0
0
1985
1985
1985
1
Jamestown Estates
$619,900
$619,900
$619,900
1,932
1,932
1,932
1962
1962
1962
1
Rushland Landing
$650,000
$1,524,500
$2,399,000
0
2,440
4,879
2008
2008
2008
2
Capri Isles
$639,900
$818,950
$998,000
1,625
2,070
2,515
1964
1970
1976
2
Highland Terrace
$134,999
$211,250
$287,500
1,248
1,266
1,284
1970
1996
2021
2
Wyboo Pointe
$198,500
$198,500
$198,500
1,848
1,848
1,848
2000
2000
2000
1
Boulder Bluff
$24,000
$190,918
$319,000
0
869
1,784
1963
1973
2016
45
River Reach Pointe
$860,000
$1,101,875
$1,750,000
0
2,202
3,495
2006
2012
2024
4
Rivertowne
$559,000
$1,142,875
$2,800,000
0
2,662
3,705
2003
2009
2023
8
Maryville
$88,088
$435,934
$635,000
0
1,214
1,871
1945
1990
2024
11
Middleton Plantation
$279,900
$941,414
$1,550,000
0
1,770
2,842
1991
2006
2023
7
Olde Park
$2,895,000
$3,598,980
$4,300,000
3,968
4,646
5,177
2002
2005
2013
5
Daniels Orchard
$385,000
$428,129
$540,000
2,103
2,232
2,816
2015
2022
2024
7
Brookdale
$324,000
$353,914
$410,000
1,346
2,001
2,952
2008
2013
2017
14
Wakendaw On The Creek
$1,150,000
$1,150,000
$1,150,000
2,446
2,446
2,446
1987
1987
1987
1
Colony North
$285,000
$345,268
$419,900
1,244
1,836
2,789
1973
1997
2016
20
Sea Aire
$640,000
$654,950
$669,900
2,184
2,246
2,308
2018
2018
2018
2
Whitehall
$272,000
$426,600
$560,000
1,421
2,296
3,403
1991
1999
2004
21
Harborwalk
$547,000
$547,000
$547,000
2,064
2,064
2,064
2019
2019
2019
1
Wild Dunes
$75,500
$1,700,066
$11,865,750
0
1,991
6,808
1979
1989
2007
91
Wild Dunes Resort
$274,000
$892,060
$2,445,000
0
1,007
2,395
1979
1997
2007
13
Winterseat
$169,000
$432,000
$695,000
0
1,506
3,011
2008
2008
2008
2
Marsh Winds Condominium
$485,000
$485,000
$485,000
1,392
1,392
1,392
2004
2004
2004
1
Barons Retreat
$485,000
$544,667
$599,000
1,981
2,506
3,038
2007
2008
2011
3
Riverfront
$230,000
$912,000
$1,550,000
0
1,310
2,460
1992
2002
2014
5
Woodside Manor
$205,000
$263,495
$360,000
980
1,282
1,645
1971
1974
1978
22
Eagle Landing
$429,900
$506,267
$599,000
1,760
2,567
3,592
1988
1999
2018
3
Wyndham Ocean Ridge
$259,000
$516,403
$1,500,000
0
1,131
6,000
1978
1989
2011
29
Oakhaven Plantation
$699,000
$969,799
$1,695,000
1,596
2,214
3,162
1987
1988
1988
5
Ashley Cove
$424,780
$439,443
$459,990
2,518
2,726
3,053
2023
2024
2024
8
Waylyn
$65,000
$259,587
$599,000
0
936
1,294
1940
1946
2023
47
Pepperidge
$239,900
$280,156
$315,000
1,029
1,378
1,704
1982
1988
2001
10
Governors Cay
$554,900
$617,733
$874,900
1,767
1,861
2,220
2020
2021
2022
9
Wespanee Plantation
$725,000
$948,333
$1,150,000
1,966
2,608
3,518
1966
1969
1975
6
Moreland
$552,000
$834,750
$1,349,000
1,073
2,173
3,011
1950
1953
1956
8
Marsh Cove
$550,000
$604,998
$639,993
1,842
2,172
2,732
1980
1982
1984
4
Summerfield
$309,900
$317,450
$325,000
1,432
1,462
1,493
2005
2005
2005
2
The Peninsula
$315,000
$426,236
$598,000
994
1,492
1,943
2003
2005
2006
22
Cordgrass Landing
$560,310
$676,918
$1,225,775
2,424
2,943
3,725
2023
2023
2024
17
Liberty Hall Plantation
$242,000
$335,365
$437,900
1,064
1,922
3,665
2004
2008
2021
41
Southampton Pointe
$319,000
$392,831
$549,900
767
960
1,409
1999
1999
1999
18
Oakmont
$275,000
$275,000
$275,000
1,338
1,338
1,338
1981
1981
1981
1
Summerville Farms
$559,000
$559,000
$559,000
2,150
2,150
2,150
1988
1988
1988
1
Anavesta Park
$94,990
$309,568
$524,145
0
1,000
2,000
2024
2024
2024
2
Paddock Pointe
$309,950
$372,907
$449,000
1,260
2,291
2,948
2006
2008
2010
7
Cedar Wood Estates
$150,000
$150,000
$150,000
1,300
1,300
1,300
1978
1978
1978
1
Laurel Oak
$399,000
$669,450
$899,900
1,168
2,596
3,572
2013
2020
2024
4
Brickhope Greens
$315,000
$349,144
$380,000
1,412
1,842
2,641
2007
2008
2011
9
Grand Oaks Plantation
$299,900
$448,105
$599,900
1,258
1,785
2,853
2000
2005
2017
56
Sangaree
$75,500
$290,075
$385,000
0
1,369
2,500
1972
1985
2024
67
Mixson
$400,000
$553,424
$639,500
924
1,962
2,506
2008
2019
2022
17
Twelve Oaks
$238,000
$304,197
$369,890
816
1,078
1,388
2002
2002
2002
19
Copahee View
$299,900
$787,138
$1,725,000
0
1,569
3,035
1991
2007
2023
13
Folly Beach
$795,000
$1,889,386
$3,895,000
0
1,896
3,700
1940
1986
2025
22
Harleston Place
$995,000
$1,392,500
$1,625,000
1,774
2,400
2,658
1984
1993
1998
4
Brickhope Plantation
$310,000
$373,291
$500,000
1,288
2,152
3,712
2007
2011
2018
11
Bridlewood Farms
$319,900
$355,860
$399,500
1,807
2,190
2,698
2009
2012
2017
5
Archdale
$85,000
$410,168
$950,000
0
1,978
3,000
1977
1988
2024
32
Tanner Plantation
$285,000
$529,597
$1,125,000
1,120
2,409
4,432
2003
2009
2021
58
Weatherstone
$270,000
$350,268
$410,000
1,075
1,834
2,582
2004
2006
2008
28
Stiles Point
$548,000
$671,000
$849,000
1,620
2,027
2,272
1961
1964
1968
6
Macedonia Eastern Side
$125,000
$323,986
$499,000
0
1,440
2,432
1984
2006
2023
7
Village Green
$365,000
$480,052
$599,999
1,144
1,990
3,405
1993
1997
2001
24
Maybank Village
$450,000
$544,147
$665,000
1,598
2,196
2,889
2015
2016
2019
15
Tidal Walk
$865,000
$916,650
$975,000
2,806
3,028
3,423
2016
2016
2017
6
Norwood Oaks
$1,079,620
$1,202,573
$1,356,554
2,412
3,069
3,521
2024
2024
2024
15
Bryant Acres
$330,000
$364,500
$399,000
2,230
2,405
2,580
1966
1977
1988
2
The Slips at Ripley
$129,000
$138,000
$145,000
0
700
1,050
1985
1985
1986
6
Taylor Plantation
$389,999
$435,433
$500,000
1,804
2,511
3,053
2008
2012
2013
9
Battery Gaillard
$549,000
$722,967
$910,000
2,110
2,540
3,252
2008
2016
2023
3
Twin Oaks
$305,000
$457,475
$815,000
0
1,269
1,916
1965
1978
1996
4
Mcclellanville
$137,000
$550,450
$1,200,000
0
1,184
3,572
2010
2018
2024
7
Brightwood
$343,900
$396,655
$439,000
1,702
1,923
2,200
2012
2020
2024
9
The Villages In St Johns Woods
$573,000
$820,380
$1,100,000
1,556
2,283
2,756
2003
2010
2019
5
Ashley Villas
$200,000
$240,211
$288,000
992
1,244
1,681
1975
1977
1979
9
Blackberry Creek
$325,000
$401,317
$498,900
1,578
2,756
3,508
2007
2008
2010
12
St Helena
$49,000
$565,967
$2,250,000
0
826
3,179
1989
2000
2015
9
Darrell Creek
$549,000
$1,336,921
$2,395,000
0
3,291
4,914
1998
2009
2024
19
Farmdale
$749,900
$1,449,967
$1,800,000
0
2,457
4,946
1975
1981
1987
3
Terrabrook
$690,000
$776,000
$849,000
2,132
2,797
3,135
2008
2011
2013
4
Lakeview Commons
$215,000
$260,600
$285,000
986
1,429
1,898
2007
2015
2020
17
Facing East
$350,000
$581,333
$995,000
0
0
0
3
Old Mt Pleasant
$799,000
$1,902,920
$4,250,000
0
2,007
4,100
1940
1978
2025
45
Tides Condominiums
$949,000
$2,165,900
$3,395,000
1,116
2,198
3,102
2007
2008
2008
10
Dockside
$420,000
$607,590
$759,000
1,121
1,267
1,580
1977
1979
1980
10
Pointe at Primus
$818,000
$868,857
$930,000
2,329
2,588
2,694
2019
2020
2020
7
Tibwin
$79,000
$182,000
$285,000
0
924
1,848
1998
1998
1998
2
Heaton Place
$275,000
$326,580
$419,000
1,189
1,693
3,010
1987
1997
2024
5
Villas at Charleston Park
$325,900
$351,338
$385,000
1,569
1,748
1,869
2005
2009
2018
8
Pier View
$439,000
$540,250
$775,000
890
1,225
1,800
2007
2008
2008
8
White Gables
$310,000
$383,774
$479,900
1,333
2,006
2,843
2001
2009
2020
46
Lincolnville Square
$324,000
$390,998
$449,000
1,637
2,616
3,121
2017
2018
2019
3
Brick Church
$400,000
$675,000
$950,000
0
0
0
2
Longpoint
$549,999
$877,173
$1,750,000
1,264
2,157
3,233
1987
1992
2000
30
Northwood Estates
$290,000
$324,436
$369,900
1,329
1,704
1,963
1967
1977
1993
11
Windermere
$860,000
$1,410,571
$1,955,000
1,980
3,100
4,581
1939
1965
2023
7
Central Avenue Townhomes
$257,980
$276,163
$303,000
1,898
2,021
2,400
2023
2023
2024
8
Rice Fields at Bulls Bay
$425,000
$425,000
$425,000
0
0
0
1
Pecan Grove
$315,000
$605,598
$850,000
1,066
2,381
4,280
1958
1998
2024
5
Parrot Creek
$1,200,000
$1,643,000
$2,100,000
2,631
3,326
3,687
1990
1992
1995
3
Oak Creek
$264,900
$302,941
$334,999
1,052
1,261
1,700
1991
1993
1996
7
Doctors Creek
$170,000
$170,000
$170,000
0
0
0
1
Polly Point Plantation
$199,000
$807,000
$1,900,000
0
1,046
3,236
2016
2019
2022
6
Sunset Point
$850,000
$1,965,713
$2,899,990
0
2,247
3,268
1992
2008
2025
7
Ashley River Commons
$275,000
$300,175
$324,900
1,473
1,642
2,060
2003
2012
2021
8
The Oaks Marsh View
$1,835,000
$1,853,333
$1,875,000
3,016
3,124
3,188
2017
2017
2018
3
Radcliffeborough
$559,000
$1,347,974
$3,599,000
911
1,966
3,808
1830
1890
2008
19
Wraggborough
$550,000
$1,434,438
$2,495,000
662
1,940
3,244
1805
1880
2002
8
Andersonville
$262,000
$262,000
$262,000
1,680
1,680
1,680
2023
2023
2023
1
Byrnes Downs
$416,000
$719,000
$1,435,000
861
1,210
1,450
1940
1944
1945
6
Pepperhill
$209,000
$286,317
$340,000
900
1,345
2,752
1966
1972
1982
28
Harmony Hall
$40,000
$225,125
$325,000
0
1,334
2,073
2007
2020
2024
8
Swygerts Landing
$529,900
$739,700
$975,000
2,026
2,675
3,306
2011
2015
2020
7
Ladys Island
$119,900
$748,427
$2,680,000
0
1,710
3,897
1995
2008
2024
12
Mariners Cay
$20,000
$343,629
$699,000
0
717
1,378
1982
1993
2006
23
Rose Hill
$249,000
$373,400
$675,000
1,040
1,552
2,079
1967
1980
2008
5
West Glow
$399,999
$399,999
$399,999
1,525
1,525
1,525
1958
1958
1958
1
The Retreat at Riverland
$385,000
$422,100
$472,000
1,058
1,234
1,440
2003
2004
2005
14
The Retreat
$560,000
$560,000
$560,000
1,280
1,280
1,280
2001
2001
2001
1
Rivers Point Row
$259,000
$295,375
$387,500
950
1,072
1,240
1978
1985
2001
4
The Bluffs at Pinefield
$536,930
$564,497
$601,990
1,906
2,286
2,486
2024
2024
2024
13
The Retreat at Edisto
$630,000
$630,000
$630,000
1,280
1,280
1,280
2001
2001
2001
1
Seaside Plantation
$425,000
$888,694
$1,875,000
1,680
2,321
3,395
1988
2010
2018
17
Wildwood
$222,130
$710,128
$2,225,000
925
1,589
3,538
1956
1973
1988
8
Porcher Point
$399,500
$411,000
$421,000
2,073
2,162
2,341
2023
2023
2023
3
Stratton by the Sound
$915,000
$1,300,125
$1,799,000
2,240
2,896
3,629
2018
2019
2021
8
Turn of River
$650,000
$650,000
$650,000
1,477
1,477
1,477
2000
2000
2000
1
Mossy Oaks
$309,900
$418,700
$515,000
1,288
1,555
1,836
1961
1988
2022
4
Summerville
$340,000
$340,000
$340,000
0
0
0
1
Pine Forest
$249,000
$398,400
$475,000
988
2,069
2,616
1977
2002
2019
5
Awendaw Village
$1,100,000
$1,331,333
$1,499,000
2,979
3,158
3,408
2021
2021
2021
3
Wescott Glen
$397,000
$397,000
$397,000
2,649
2,649
2,649
2006
2006
2006
1
Hickory Ridge
$305,000
$391,625
$445,000
2,028
2,574
3,372
2012
2014
2016
4
Willowbrook
$25,000
$237,986
$289,999
0
1,055
1,830
1975
1979
1982
7
Devon Forest
$239,900
$346,718
$438,000
1,173
1,688
2,313
1986
1999
2024
17
Cokers Commons
$258,000
$289,000
$315,000
1,304
1,644
1,871
2017
2018
2020
3
Wagener Terrace
$400,000
$1,072,138
$1,895,000
1,025
1,803
3,246
1927
1954
2024
42
Shasta Meadows
$15,000
$229,458
$344,735
0
1,149
1,725
1967
2010
2024
5
Summerville Place
$210,000
$340,554
$420,000
1,056
1,510
1,975
1988
1990
1992
13
Greenhurst
$49,900
$278,120
$367,500
0
1,321
1,941
1970
1981
2001
25
Moss Grove Plantation
$75,900
$339,590
$445,000
0
2,054
3,220
2007
2015
2018
21
The Riverway at Aichele Terrace
$150,000
$179,175
$200,000
1,066
1,066
1,066
1985
1985
1985
8
Forest Lawn
$170,000
$287,580
$340,000
1,075
1,370
2,334
1958
1976
2024
10
Jacobs Point
$699,950
$806,106
$1,195,000
2,171
2,798
3,426
2006
2016
2023
8
Wexford Sound
$499,000
$624,750
$700,000
1,673
1,951
2,199
1995
1997
1998
4
Crossgate
$245,000
$250,000
$255,000
1,166
1,255
1,344
1972
1972
1972
2
Grand Bees
$424,500
$502,368
$649,900
1,424
2,139
3,100
2016
2021
2022
22
Pelican Pointe Villas
$390,000
$417,254
$439,000
1,133
1,239
1,340
2007
2007
2007
11
Stratton Capers
$70,000
$210,833
$280,000
0
1,016
1,760
1965
1983
2020
6
Lawton Bluff
$440,000
$668,909
$825,000
1,176
1,881
2,784
1959
1965
1973
11
Ocean Ridge
$56,000
$433,368
$1,075,000
0
973
2,014
1980
1988
2008
11
Springfield
$345,000
$414,113
$480,000
1,146
1,512
2,104
1960
1965
1985
8
Deer Park
$60,000
$379,106
$655,700
0
1,555
2,761
1956
2004
2024
16
Summertrees
$430,000
$478,663
$559,000
1,372
1,745
2,646
2005
2006
2007
6
Bohicket Marina Village
$555,000
$577,667
$599,000
855
923
1,058
1982
1982
1983
3
M Hill
$169,000
$274,500
$380,000
517
656
794
1922
1944
1966
2
Tramway
$250,000
$497,225
$1,700,000
928
1,701
2,300
1973
1986
1998
8
Evergreen
$99,319
$307,582
$352,900
0
1,586
2,174
1972
2019
2024
63
Point James
$205,000
$258,000
$292,000
722
959
1,195
1974
1974
1974
6
Belvedere Estates
$345,000
$406,000
$450,000
1,352
1,823
2,250
1960
1964
1971
5
The Peninsula Condominiums
$194,900
$248,677
$335,000
691
927
1,394
1998
1998
1998
13
Reminisce
$325,000
$384,955
$469,000
1,473
2,425
3,621
2007
2012
2017
20
Arbor Walk
$319,000
$410,667
$545,000
1,285
2,561
3,280
2006
2008
2010
6
Santee Lakes
$34,900
$228,800
$544,000
0
993
2,000
1982
1985
1988
3
Jamestowne Village
$459,900
$552,225
$660,000
1,359
1,539
1,844
2003
2003
2003
4
Fairmont South
$349,000
$382,443
$425,000
1,700
2,485
2,959
2013
2016
2018
14
Glyn Terrace
$225,000
$298,000
$365,000
1,070
1,390
1,514
1953
1964
1968
5
Ocean Neighbors
$569,895
$729,149
$1,275,000
1,786
2,250
4,172
1999
2004
2014
6
Romain Point
$1,275,000
$1,400,000
$1,650,000
0
0
0
3
Hobcaw Point
$945,000
$2,181,250
$3,450,000
1,551
2,536
3,902
1957
1968
1992
6
Thornley Forest
$313,000
$313,000
$313,000
1,283
1,283
1,283
2005
2005
2005
1
Belvedere Heights
$339,000
$369,500
$400,000
1,704
1,792
1,879
1964
1966
1968
2
Carolina Cove
$225,000
$266,378
$319,000
868
1,079
1,389
1973
1973
1973
9
Murray
$680,000
$680,000
$680,000
0
0
0
1
Silverhills
$75,000
$217,500
$359,999
0
909
1,818
2024
2024
2024
2
Summer Glen
$300,000
$342,380
$375,000
0
1,584
2,400
2004
2005
2005
5
Shepard Place
$937,000
$937,000
$937,000
4,731
4,731
4,731
2006
2006
2006
1
Silverhill
$34,900
$331,630
$669,000
0
2,204
4,534
1978
1995
2007
5
Boltons Landing
$360,000
$516,676
$675,000
1,524
2,173
3,361
2009
2012
2017
21
Greenhill
$659,999
$659,999
$659,999
1,716
1,716
1,716
1999
1999
1999
1
Whipper Barony
$225,000
$355,000
$455,000
750
1,044
1,300
1941
1984
2024
4
The Marshes at Cooper River
$450,000
$564,714
$675,000
1,817
1,988
2,510
2018
2019
2020
7
Cedar Springs
$165,000
$474,292
$1,450,000
0
1,496
2,253
1930
2002
2024
13
Mattassee
$274,900
$274,900
$274,900
1,450
1,450
1,450
1993
1993
1993
1
Brookwood
$274,000
$306,790
$349,900
1,164
1,446
2,399
2004
2006
2007
10
Robynwyn
$215,000
$269,369
$339,900
973
1,180
2,000
1976
1987
2022
13
Park Circle
$297,500
$595,734
$900,000
0
1,672
2,934
1938
1975
2024
64
Windswept Villas
$1,295,000
$1,437,000
$1,585,000
756
1,174
1,683
1982
1983
1987
5
Prince
$1,295,000
$1,295,000
$1,295,000
2,890
2,890
2,890
1975
1975
1975
1
Corey Woods
$258,500
$328,327
$550,000
1,255
1,573
3,067
1971
1980
2010
23
Rotherwood Estates
$572,500
$646,625
$740,000
1,555
1,872
2,203
1961
1963
1963
4
Brickyard Plantation
$619,000
$1,163,261
$4,750,000
1,408
2,900
7,828
1992
1995
2004
18
The Lakes
$259,000
$294,940
$369,000
1,028
1,203
1,820
1984
1991
2002
10
Shell Pointe at Cobblestone Village
$315,000
$362,810
$382,900
1,183
1,924
2,361
2021
2022
2023
12
Lighthouse Point
$399,000
$772,135
$1,199,000
1,050
1,982
3,348
1964
1976
2017
13
Windsor Hill
$234,999
$310,490
$375,000
947
1,670
2,200
1987
1992
2004
10
Windsor Place
$130,000
$246,000
$449,000
733
1,124
1,896
1940
1948
1950
4
Newington Plantation
$299,999
$412,061
$550,000
1,625
1,971
2,424
1974
1984
1999
13
Hawthorne Landing
$306,900
$348,979
$449,900
1,513
1,725
1,987
2022
2023
2024
14
Yeamans Park
$219,000
$323,877
$425,000
925
1,303
2,022
1940
1961
1974
18
Summerton
$129,000
$314,300
$495,000
0
1,585
3,150
1910
1979
2023
5
Holly Court
$219,900
$247,175
$268,900
938
1,052
1,153
1978
1979
1979
4
Berkeley Run
$299,000
$524,750
$875,000
0
1,608
4,231
1991
1995
1999
4
Ivy Hall
$544,900
$573,211
$629,000
1,296
1,654
2,150
1996
1999
2001
9
Spencer Creek Woods
$320,000
$349,971
$369,900
1,283
1,816
2,050
2013
2015
2016
7
Willow Bend
$277,065
$293,109
$326,565
1,686
1,731
1,805
2023
2024
2024
16
Crawford Place
$83,450
$330,238
$600,000
0
1,044
2,217
2004
2004
2004
4
Oak Grove
$194,000
$289,780
$395,000
989
1,562
2,267
1955
1985
2023
5
Hunters Bend
$334,900
$368,003
$455,000
1,364
2,308
3,119
2005
2013
2020
29
Millwood
$279,999
$319,875
$375,000
1,482
1,717
1,933
1968
1971
1975
4
Nafair
$275,000
$300,000
$325,000
699
866
1,034
1940
1940
1940
2
Sunny Dell
$6,500
$6,500
$6,500
0
0
0
1
Magnolia Ranch
$450,000
$576,633
$799,900
1,300
1,807
2,222
1959
1970
1989
3
Sandy Oaks
$152,000
$174,500
$197,000
1,584
1,856
2,128
1997
2000
2002
2
Winnsboro Lakes
$360,000
$448,000
$495,000
1,216
1,546
1,770
1989
2001
2005
10
Scotts Mill
$275,000
$304,625
$349,950
1,167
1,536
1,948
2001
2003
2005
6
Snee Farm Lakes
$336,000
$423,333
$499,000
1,262
1,299
1,354
1982
1982
1983
3
Carolina Bay
$380,000
$576,837
$845,000
1,443
2,383
3,712
2007
2013
2021
52
White Church Place
$310,000
$343,200
$425,000
1,251
1,620
2,410
1979
1986
1992
14
Baker Plantation
$345,000
$388,970
$494,500
1,594
2,058
2,940
2007
2011
2015
10
College Park
$185,000
$275,826
$330,000
976
1,295
1,591
1965
1979
1987
19
Candlewood
$549,900
$573,267
$595,000
1,366
1,571
1,897
1980
1982
1986
3
Ashwood
$1,025,000
$1,025,000
$1,025,000
2,489
2,489
2,489
1977
1977
1977
1
Bees Crossing
$599,900
$670,817
$775,000
1,792
2,333
2,709
2020
2021
2022
6
Clemson Terrace
$165,000
$239,800
$320,000
1,440
1,699
1,904
1989
1997
2005
5
Bayview Farms
$619,000
$688,850
$849,950
1,480
1,810
2,266
1993
1996
1999
7
Rivertowne On The Wando
$735,000
$1,408,588
$4,500,000
2,110
3,221
6,800
1997
2005
2024
15
Rosemont
$120,000
$149,967
$199,900
0
297
890
1950
1950
1950
3
Pigeon Bay
$75,000
$147,500
$220,000
0
672
1,344
2003
2003
2003
2
Simmons Creek
$750,000
$750,000
$750,000
2,460
2,460
2,460
2011
2011
2011
1
Persimmon Hill Townhouses
$199,000
$263,343
$319,900
992
1,632
2,583
2002
2004
2006
15
Woodward Pointe
$875,000
$1,058,133
$1,299,900
2,364
2,782
3,200
2002
2003
2005
6
Kings Grant
$245,000
$365,364
$549,900
1,155
1,966
3,262
1970
1976
1996
25
Harbour Lake
$259,900
$315,271
$389,000
1,053
1,521
2,205
1977
1980
1983
7
Bowman Park
$750,000
$792,000
$834,000
2,297
2,297
2,297
2017
2017
2017
2
Lake Palmetto
$420,000
$464,000
$600,000
2,144
2,185
2,245
2003
2005
2007
5
Park Hill Place
$315,000
$325,500
$339,000
1,444
1,500
1,579
2002
2003
2005
4
Katony
$385,000
$674,183
$937,550
0
514
1,543
1984
1984
1984
3
Briarwood
$215,000
$331,488
$425,000
1,046
1,851
2,358
1976
1990
2006
8
Westchester
$460,000
$516,913
$619,900
925
1,524
1,950
1965
1967
1971
4
Gregorie Ferry Towns
$328,890
$353,086
$372,589
1,036
1,036
1,036
2021
2022
2022
5
The Commons
$295,000
$295,000
$295,000
1,556
1,556
1,556
1988
1988
1988
1
Westside
$199,000
$995,567
$2,600,000
0
1,475
2,642
1915
1953
2021
27
Deer Field Hall
$365,000
$401,250
$450,000
1,248
1,992
2,654
2014
2016
2018
4
Nafair Addition
$189,000
$222,000
$275,000
775
1,157
1,548
1940
1942
1945
3
Enclave On Bohicket
$360,000
$1,167,500
$1,975,000
0
2,712
5,425
2007
2007
2007
2
Meggett
$150,000
$686,045
$1,975,000
0
1,671
3,700
1918
1978
2008
11
Heron Pointe
$1,250,000
$1,313,000
$1,390,000
2,157
2,924
3,966
1986
1991
1999
3
Snowden
$540,000
$646,750
$897,000
0
1,340
2,334
1973
2004
2021
4
Dovefield
$185,000
$207,900
$225,000
850
850
850
1985
1985
1985
5
Chapel Branch Villas
$233,990
$261,023
$300,000
1,634
1,634
1,634
2023
2024
2024
6
Sandy Springs
$89,999
$339,500
$589,000
0
964
1,928
1994
1994
1994
2
University Place
$325,000
$331,667
$340,000
644
644
644
1984
1984
1985
3
Hibben Ferry II
$359,000
$371,000
$383,000
1,030
1,030
1,030
1983
1983
1983
2
Golf Shore Villas
$475,000
$515,000
$555,000
1,123
1,262
1,400
1977
1977
1977
2
Horizon Village
$365,000
$410,978
$475,000
1,377
1,458
1,584
2007
2018
2020
9
Elms of Charleston
$209,900
$322,656
$385,000
1,152
1,630
2,087
1987
1999
2015
24
Shady Oaks
$279,900
$293,686
$305,000
1,560
1,648
1,684
2020
2021
2022
7
Shipwatch Villa
$115,000
$1,236,250
$1,785,000
1,084
1,380
1,616
1984
1984
1984
6
Guilford Gates
$124,900
$726,256
$958,000
0
2,513
3,751
2016
2021
2024
4
Oak Knoll
$350,000
$391,271
$440,000
1,732
2,091
2,583
1977
1981
1985
7
Green Bay Meadows
$250,000
$333,800
$399,000
925
1,297
1,699
1956
1957
1960
5
Cedar Grove
$395,000
$555,422
$719,900
2,027
2,871
3,528
2002
2010
2018
9
Rogers Cove
$213,000
$213,000
$213,000
1,130
1,130
1,130
1985
1985
1985
1
Charleston National
$525,000
$883,066
$2,950,000
1,600
2,476
3,570
1993
2004
2024
35
Appian Landing III
$374,900
$436,950
$499,000
1,984
2,004
2,023
1991
1991
1991
2
Perreyclear Pointe
$245,000
$245,667
$247,000
1,054
1,054
1,054
1967
1967
1967
3
Stono Ferry
$179,900
$825,228
$1,499,000
0
2,390
3,582
1996
2011
2023
21
Bridges of Summerville
$290,000
$375,791
$549,900
1,223
2,017
3,661
2001
2003
2007
26
Parkwood Estates
$425,000
$548,333
$695,000
1,122
1,383
1,813
1952
1953
1954
3
Pimlico
$335,500
$520,002
$899,987
0
2,079
3,929
1964
1995
2024
25
Marsh Grass Condominiums
$320,000
$320,000
$320,000
750
750
750
1975
1975
1975
1
Lincolnville
$100,000
$267,714
$385,000
0
1,070
2,250
1945
1984
2010
7
Northpointe
$275,000
$304,929
$339,900
1,170
1,284
1,520
1987
1994
2005
7
Coosaw Commons
$239,900
$283,008
$329,900
1,231
1,556
1,706
2004
2004
2005
12
Woodland Lakes
$290,000
$347,442
$374,900
1,426
1,731
1,960
1990
1996
2002
7
Quail Hollow
$255,000
$500,000
$695,000
1,044
1,559
2,224
1985
1989
1992
3
Air Harbor
$350,000
$450,960
$545,000
1,234
1,404
1,523
1953
1958
1967
5
Greencrest
$500,000
$603,625
$729,500
0
1,483
2,351
1971
1990
2023
4
Bay Creek Villas
$115,000
$510,300
$670,000
864
950
1,175
1986
1986
1986
7
Summerwind
$754,000
$754,000
$754,000
1,308
1,308
1,308
1981
1981
1981
1
Hidden Cove
$145,000
$724,260
$1,975,000
602
1,745
3,150
1985
1995
2007
15
Carol Oaks
$655,000
$663,000
$675,000
1,789
1,982
2,149
2007
2010
2012
5
Cross Subd (Longpoint)
$274,900
$329,560
$399,900
0
1,034
1,791
1985
2007
2023
5
Lake Moultrie Estates
$350,000
$395,000
$415,000
1,708
1,790
2,000
1985
1995
2020
4
Sea Island Hamlet
$875,000
$899,750
$924,000
1,956
1,982
2,004
2019
2020
2021
4
Lakes of Summerville
$228,000
$292,075
$410,000
1,070
1,411
3,536
2004
2010
2018
52
Belle Hall
$450,000
$1,398,647
$2,875,000
0
2,722
4,663
1994
2003
2020
40
Edisto Estates II
$225,000
$287,500
$350,000
0
1,491
2,982
2006
2006
2006
2
Long Grove at Seaside Farms
$350,000
$390,250
$459,000
786
960
1,197
1999
1999
1999
6
Brentwood
$250,000
$280,000
$309,999
940
1,126
1,313
1962
1963
1963
2
Staffordshire
$400,000
$500,833
$549,000
1,360
1,872
2,398
2008
2012
2013
6
Inglewood
$279,999
$287,500
$295,000
1,090
1,317
1,544
2004
2005
2005
2
Ehrhardt
$79,000
$79,000
$79,000
1,200
1,200
1,200
1
Drakesborough
$285,000
$335,886
$385,000
1,354
2,047
2,904
2008
2012
2017
22
Stiles Point Plantation
$1,475,000
$1,965,000
$2,425,000
3,394
3,661
3,964
1990
2001
2007
3
Eastwood
$975,000
$1,540,000
$2,990,000
0
2,228
4,066
1964
1981
1989
4
Ashley House
$210,000
$383,954
$549,000
530
865
1,149
1965
1965
1967
13
Bishop Farms
$300,000
$300,000
$300,000
0
0
0
1
Scanlonville
$700,000
$1,564,363
$2,999,900
0
1,482
4,655
1983
2009
2023
8
Spring Grove Plantation
$299,900
$379,968
$550,000
1,478
2,265
4,212
2005
2013
2020
36
Center Lake
$599,000
$700,000
$805,000
1,514
1,671
1,884
1993
1994
1995
3
Eagle Run
$315,000
$347,131
$399,999
1,188
1,919
2,889
2005
2007
2012
19
Northwoods Pointe
$265,000
$331,123
$399,990
1,306
1,726
2,320
2003
2003
2003
4
Seagate
$320,000
$322,250
$324,500
1,016
1,042
1,067
2002
2003
2003
2
Southern Magnolias
$320,000
$372,475
$444,900
1,467
2,153
3,337
2003
2005
2006
4
Marsh Side
$327,000
$333,000
$339,000
1,628
1,646
1,663
2003
2003
2003
2
The Enclave at Lake Marion
$75,000
$234,769
$316,620
0
1,017
1,526
2023
2023
2023
3
Pineview Acres
$93,000
$284,050
$364,900
0
1,367
1,905
1965
1976
2023
8
Hunt Club Phase II
$535,000
$608,130
$685,000
2,605
2,847
3,217
2004
2008
2019
5
East Bridge Town Lofts
$310,000
$399,279
$440,000
625
964
1,183
1980
1986
1986
14
Ashley Forest
$339,900
$638,709
$779,000
1,091
1,793
3,271
1931
1972
2024
11
Regatta On James Island
$269,900
$321,940
$445,000
709
881
1,304
2006
2006
2006
10
Beach Walk
$425,000
$1,107,143
$1,795,000
0
1,809
3,431
1959
1988
2007
7
Lake Hunter Commons
$675,000
$729,114
$774,900
1,564
1,805
1,916
1999
2000
2003
7
The Lakes at Winyah
$586,985
$713,791
$839,900
1,898
2,420
2,620
2023
2023
2023
7
College Heights
$262,000
$322,167
$365,000
916
1,283
1,504
1971
1971
1971
3
Kensington Park
$279,999
$314,000
$340,000
1,355
1,682
1,963
1989
1991
1998
5
Anna Vista
$625,000
$625,000
$625,000
0
0
0
1
Beresford Commons
$299,000
$351,853
$415,000
1,008
1,274
1,620
2005
2006
2006
19
The Cottages at Johns Island
$424,999
$489,690
$599,000
1,620
2,012
2,556
2011
2016
2021
10
Rosemead
$824,987
$824,987
$824,987
2,254
2,254
2,254
1975
1975
1975
1
Happy Hill
$250,000
$250,000
$250,000
1,300
1,300
1,300
1950
1950
1950
1
Woodland Shores
$210,000
$683,800
$1,350,000
0
1,593
2,029
1932
1975
2024
10
Glendale Acres
$1,045,000
$1,045,000
$1,045,000
3,143
3,143
3,143
1979
1979
1979
1
University Park
$27,000
$206,792
$369,000
0
1,034
1,920
2007
2010
2013
13
Conifer Hall
$100,000
$232,550
$309,900
0
1,061
1,502
1980
1985
1990
8
Marrington Villas at Cobblestone
$329,000
$392,965
$449,990
1,134
1,910
2,767
2011
2015
2018
6
Tilly Island
$480,000
$864,500
$1,249,000
0
493
986
2015
2015
2015
2
Tea Farm Creek
$650,000
$650,000
$650,000
0
0
0
1
Cherokee Hall
$75,000
$197,500
$425,000
0
0
0
4
Woodland Heights
$200,000
$262,233
$325,000
975
1,198
1,420
1979
1979
1980
6
Verdier Pointe
$449,900
$480,557
$516,810
1,516
1,795
1,988
2024
2024
2025
37
Quail Arbor V
$100,000
$340,175
$479,500
0
1,659
3,052
1976
1980
1990
12
The Meridian
$275,000
$355,908
$449,000
740
1,027
1,329
1993
1993
1993
12
Battery Haig On The Stono
$275,000
$427,667
$699,000
0
645
1,936
2007
2007
2007
3
Planters Pointe
$500,000
$761,925
$1,099,000
1,230
2,380
3,100
1996
2002
2008
16
Cypress Ridge
$278,000
$338,755
$459,900
1,314
1,918
2,447
2010
2016
2022
14
Heathwood
$468,500
$540,375
$619,000
1,292
1,467
1,610
1959
1961
1965
4
Old Fort Estates
$160,000
$492,425
$679,900
0
1,096
2,736
2007
2008
2008
4
South Pointe
$349,000
$431,180
$559,000
1,720
2,366
3,390
1987
2003
2021
5
Drayton On The Ashley
$250,000
$492,690
$748,000
1,366
2,065
3,298
1966
1974
2006
10
Lieben Park
$550,000
$628,960
$719,900
1,644
2,088
2,845
2012
2012
2013
5
Country Club II
$899,000
$1,728,800
$2,795,000
2,566
3,328
4,018
1960
1964
1967
5
Sangaree Gardens
$225,000
$281,800
$309,000
1,076
1,309
1,709
1989
1992
1999
5
Stonoview
$274,900
$854,465
$1,219,000
0
2,527
3,216
2015
2019
2022
20
Grimball Gates
$749,900
$849,217
$937,500
2,332
2,821
3,514
2001
2003
2007
6
Newington Patio Homes
$268,900
$324,400
$379,900
1,052
1,180
1,307
1983
1983
1983
2
Tall Pines
$235,000
$347,579
$440,000
1,287
1,852
2,492
1972
1988
2004
21
Royal Harbor
$137,000
$649,998
$929,000
0
2,583
4,445
2023
2024
2024
5
St Andrews
$225,000
$225,000
$225,000
0
0
0
1
Hopkinson Point
$2,995,000
$2,995,000
$2,995,000
6,126
6,126
6,126
2005
2005
2005
1
The Refuge at Ravenel
$229,900
$593,300
$875,000
0
1,504
2,576
2019
2019
2019
3
Steeplechase
$330,000
$378,327
$439,900
1,590
2,391
3,427
2017
2019
2021
7
Harrison Acres
$645,000
$645,000
$645,000
2,157
2,157
2,157
1972
1972
1972
1
Mackey Farms
$369,900
$395,427
$479,000
1,705
2,034
2,600
2020
2021
2022
11
Marshview Commons
$389,000
$413,994
$448,000
1,747
1,989
2,340
2007
2019
2022
18
Ashley Plantation
$250,000
$285,000
$300,000
1,259
1,356
1,510
2000
2002
2004
4
Point Pleasant
$1,000,000
$1,389,000
$2,195,000
1,852
2,548
3,314
1980
1983
1985
5
St James Estates IV
$292,500
$371,350
$420,000
1,291
1,700
2,051
1986
1989
1992
4
Brownswood Village
$250,000
$471,360
$590,000
0
1,635
2,530
2015
2017
2018
5
Rice Hollow
$500,000
$578,180
$649,899
1,677
1,978
2,127
1986
1989
1998
5
White Oak I
$149,900
$226,075
$299,900
784
1,321
1,826
1967
1987
1997
4
Lakeview at Kitfield
$374,962
$410,883
$461,705
2,032
2,378
2,721
2024
2024
2024
71
Curriboo Heights
$75,000
$137,500
$199,999
1,080
1,196
1,311
1940
1982
2024
2
Heatherwoods
$345,000
$351,333
$359,000
1,616
1,723
1,852
2005
2006
2006
3
Sedgefield Section I
$245,000
$268,600
$309,000
960
1,086
1,403
1974
1977
1982
5
Lakevue Lands
$145,000
$164,950
$184,900
1,140
1,178
1,216
1991
1995
1999
2
Pepper Plantation
$800,000
$2,662,714
$4,750,000
0
3,994
6,285
2002
2015
2020
7
Summerhaven
$325,000
$369,250
$453,000
1,219
1,968
3,070
2003
2004
2005
4
Indigo Fields
$395,500
$482,485
$698,500
1,829
2,514
3,658
1989
2001
2018
20
Driftwood Villa
$297,900
$313,175
$340,000
672
690
709
1980
1980
1981
4
Poplar Creek
$31,000
$185,167
$485,000
0
820
2,460
1996
1996
1996
3
Fairlawn
$160,000
$268,050
$385,000
1,025
1,322
1,856
1955
1975
1991
10
Fox Run Estates
$200,000
$200,000
$200,000
2,016
2,016
2,016
1998
1998
1998
1
Persimmon Hill
$225,000
$249,515
$300,000
1,072
1,337
1,629
2003
2004
2005
5
Village Park
$870,000
$932,500
$995,000
1,935
2,000
2,066
2016
2017
2017
2
Tail Race Canal
$75,000
$481,000
$1,300,000
0
1,654
4,290
1951
1978
2005
4
Old Village
$1,350,000
$4,225,964
$9,250,000
0
2,951
5,834
1860
1982
2025
28
Summerville Country Estates
$265,000
$282,450
$299,900
2,240
2,350
2,460
2001
2002
2002
2
Oak Island
$1,150,000
$1,658,000
$2,499,000
2,172
3,181
4,428
1977
1992
2008
3
Branch Creek
$279,000
$387,732
$575,000
1,408
2,126
3,520
2006
2014
2016
12
Cainhoy Landing
$574,000
$812,000
$1,050,000
1,882
3,424
4,966
2005
2011
2016
2
Plum Creek
$339,900
$364,817
$390,000
1,700
2,137
2,398
2004
2005
2006
6
Sylvan Shores
$440,000
$696,124
$864,000
1,437
2,167
2,979
1957
1982
2006
8
Remleys Point
$525,000
$2,002,475
$3,499,900
0
2,295
5,179
2016
2020
2024
4
Opti Isle
$699,000
$2,024,667
$2,875,000
0
2,159
3,281
2024
2024
2024
3
Ryan Creek
$249,900
$319,150
$355,000
1,110
1,438
1,770
1987
1995
1997
6
Laurel Grove
$557,900
$573,450
$589,000
1,888
1,896
1,903
2004
2005
2006
2
Seascape Villas
$537,000
$1,321,000
$3,495,000
580
1,276
1,930
1978
1981
1985
6
Ashborough East
$465,000
$632,391
$849,000
2,244
3,099
3,770
1978
1986
1996
14
Bluff
$249,900
$394,950
$540,000
704
1,752
2,800
1975
1983
1990
2
Point Park Estates
$345,000
$361,667
$375,000
0
765
1,240
1972
1976
1979
3
Dorchester Manor
$190,000
$224,978
$255,000
925
1,072
1,213
1979
1987
1996
5
North Charleston
$210,000
$516,338
$837,000
840
1,519
2,600
1945
1978
2024
13
Seven Farms Square
$785,000
$785,000
$785,000
2,041
2,041
2,041
2007
2007
2007
1
Molasses Creek
$1,425,000
$2,164,857
$2,995,000
2,748
3,886
4,713
1988
1990
1992
7
Wentworth Hall
$315,000
$408,681
$510,000
1,702
2,679
3,566
2008
2013
2017
16
Dorchester Terrace
$40,000
$243,316
$349,900
0
954
2,106
1930
1946
2024
31
St Julien
$550,000
$600,000
$650,000
1,780
2,106
2,431
1969
1986
2002
2
Ashley Harbor
$930,000
$1,392,250
$2,390,000
3,600
3,976
4,932
1986
1991
1996
4
Lakeview
$350,000
$450,000
$550,000
1,806
1,806
1,806
1972
1972
1972
2
Sweetbriar I
$26,550
$157,804
$700,000
0
649
3,100
2006
2017
2024
14
Parrot Bluff
$750,000
$750,000
$750,000
2,324
2,324
2,324
2000
2000
2000
1
First St Johns
$254,900
$284,450
$314,000
1,196
1,366
1,536
1976
1981
1986
2
Honey Hill
$39,000
$138,414
$295,000
0
381
1,224
1970
1977
1990
7
Windwood I & II
$255,000
$255,000
$255,000
2,126
2,126
2,126
1998
1998
1998
1
Orleans Woods
$255,000
$422,450
$569,900
1,000
1,770
2,288
1960
1967
1971
4
Black River
$200,000
$288,500
$389,000
0
747
1,200
1993
1994
1995
4
James Island
$489,000
$655,692
$1,179,000
0
1,347
3,568
1943
1996
2024
13
Lynwood
$400,000
$607,364
$710,000
1,089
1,629
2,242
1965
1979
1996
11
Trotters Ridge
$335,000
$447,450
$559,900
1,624
2,404
3,183
1989
1990
1991
2
Summer Trace
$349,900
$394,280
$437,500
1,912
2,157
2,628
2004
2004
2005
5
Charleston Park
$285,000
$319,087
$345,000
1,120
1,627
1,964
2008
2009
2010
15
Woodington
$335,000
$408,414
$515,000
1,418
2,081
3,294
1986
1987
1991
7
Hollow Oaks
$325,000
$379,975
$454,900
1,176
2,042
2,652
2006
2006
2006
4
Orange Grove Estates
$85,000
$403,155
$699,900
0
1,246
2,740
1945
1970
2020
11
Carriage Lane
$335,000
$420,383
$599,500
1,589
2,394
3,274
2003
2008
2014
6
Beverly Hills
$28,000
$252,700
$400,000
0
1,243
2,547
1965
1976
2021
11
Laurel Hill
$335,000
$371,667
$435,000
1,560
1,813
2,157
1987
1988
1989
3
The Hammocks
$405,000
$625,000
$995,000
0
611
1,832
1999
1999
1999
3
Loyal Acres
$80,000
$271,633
$539,900
0
1,521
2,772
1999
2010
2020
3
Dry Dock Village
$55,000
$307,100
$875,000
0
656
1,242
1919
1961
1968
10
Shellring at St Thomas Island
$775,000
$888,580
$1,049,000
1,944
2,350
2,752
2007
2010
2011
5
Oaks at Rivers Edge
$1,490,000
$2,245,000
$2,999,999
2,855
3,192
3,528
2006
2011
2015
2
Buckshire
$349,000
$375,091
$415,000
1,514
2,129
2,870
2005
2014
2019
11
River Birch
$220,000
$486,914
$569,900
0
2,673
3,615
2010
2012
2017
7
Fenwick Commons
$400,000
$494,500
$589,000
1,549
2,019
2,489
2011
2016
2020
2
Moss Point
$170,000
$258,214
$300,000
1,103
1,335
1,606
1977
1985
2001
7
Daniel Island Smythe Park
$1,150,000
$2,009,750
$4,500,000
1,700
3,166
5,127
2006
2012
2015
12
Vineyard Lakes
$785,000
$916,415
$985,000
1,782
2,464
2,805
2024
2024
2024
7
Royal
$120,000
$397,500
$675,000
0
1,106
2,212
1998
1998
1998
2
Fairlawn Barony
$85,000
$343,644
$440,000
0
1,586
2,400
1968
1987
2010
9
Kennedy Park
$70,000
$134,500
$199,000
945
1,222
1,500
1972
1972
1972
2
Wappoo Creek Place
$745,000
$1,108,750
$1,500,000
2,068
2,185
2,280
1982
1983
1983
4
Beaumont
$390,000
$411,627
$444,900
1,348
1,417
1,548
1988
1988
1988
3
Highwoods Plantation
$300,000
$349,000
$400,000
1,261
1,808
2,472
2003
2006
2008
8
Peninsula
$225,000
$382,428
$850,000
0
858
1,394
1998
1998
1998
6
St. Stephen
$47,500
$47,500
$47,500
0
0
0
1
Nelliefield Plantation
$535,000
$608,942
$725,000
1,660
2,182
3,010
2006
2011
2015
12
Maclaura Hall
$599,900
$802,967
$1,149,000
2,647
3,061
3,635
1989
1991
1995
3
Druid Hills
$255,000
$255,000
$255,000
1,250
1,250
1,250
1952
1952
1952
1
Bellwood
$355,000
$402,475
$519,900
1,992
2,309
2,649
2012
2012
2013
4
River Ridge Farms
$25,650
$25,950
$26,550
0
0
0
3
Oceanview
$349,000
$1,235,780
$2,349,900
0
1,845
3,963
1956
1977
2002
5
The Rocks
$279,000
$364,500
$450,000
1,885
2,380
2,876
1972
1976
1980
2
The Savannah
$189,000
$200,750
$225,000
850
916
1,066
1969
1969
1969
4
Lakewilde Plantation
$129,900
$129,900
$129,900
0
0
0
1
Tiger Swamp
$329,000
$329,000
$329,000
1,320
1,320
1,320
1972
1972
1972
1
Riverview Farms
$510,000
$733,818
$2,250,000
1,672
2,296
2,904
1998
2016
2019
11
Hampton Mill
$535,000
$571,000
$645,000
1,661
2,057
2,592
2020
2021
2021
4
Central Commons
$255,500
$280,875
$300,000
1,440
1,712
2,015
2008
2010
2016
4
Seaside Estates
$1,079,000
$1,464,500
$1,850,000
2,600
2,910
3,219
1996
2006
2015
2
Porchers Preserve
$850,000
$1,037,500
$1,225,000
2,636
3,012
3,387
2015
2016
2016
2
Lakewood
$285,000
$302,333
$325,000
1,232
1,909
2,814
1972
1989
2010
3
Farmfield
$555,000
$690,000
$824,999
1,472
1,829
2,186
1973
1974
1974
2
Oakfield
$535,000
$695,236
$899,000
1,702
2,783
3,530
2017
2019
2022
25
Etiwan Pointe
$499,500
$555,200
$630,000
1,619
1,853
2,092
2001
2007
2017
10
Longridge
$70,000
$203,725
$450,000
0
321
1,285
1965
1965
1965
4
Courtside Villas
$390,000
$440,000
$490,000
625
725
825
1979
1981
1982
2
Renaissance On Chas Harbor
$1,185,000
$2,100,571
$4,350,000
1,962
2,430
4,116
2002
2002
2002
7
Greenwood Ranches
$438,000
$660,200
$925,000
1,635
2,095
2,688
2007
2015
2023
5
Wellborn Village
$299,900
$354,120
$385,900
2,010
2,127
2,343
2011
2012
2013
5
Melrose Park Townhomes
$162,500
$177,593
$205,000
662
774
924
1978
1978
1978
7
Croghan Landing
$840,000
$1,022,667
$1,189,000
2,760
2,940
3,032
2001
2006
2011
3
Sweetgrass
$625,000
$720,380
$850,000
1,560
1,953
2,572
1990
1994
2009
5
The Bluffs at Ashley River
$360,000
$450,430
$500,000
2,146
2,627
3,215
2006
2013
2016
10
Crestwood
$234,900
$298,975
$415,000
1,040
1,409
2,100
1976
1982
1996
8
Limerick Woods
$274,900
$284,950
$290,900
1,113
1,320
1,618
1994
1996
2000
4
Shergoult
$899,500
$899,500
$899,500
2,086
2,086
2,086
2007
2007
2007
1
Whitfield On The Ashley
$192,000
$201,500
$215,000
1,080
1,130
1,166
1985
1985
1985
3
Elliottborough
$635,000
$1,366,333
$1,975,000
1,384
2,030
2,456
1840
1896
2024
6
Bee Street Condominiums
$475,000
$475,000
$475,000
951
951
951
2007
2007
2007
1
Mccalls Corner
$450,000
$647,800
$775,000
0
1,465
2,200
1957
1965
1981
5
Commonwealth
$725,000
$1,054,750
$1,469,000
1,900
2,633
3,854
1987
1993
2001
4
Paradise Lakes
$205,000
$237,840
$287,500
958
1,359
1,612
1986
1996
2002
5
Wentworth Court
$515,000
$515,000
$515,000
950
950
950
1960
1960
1960
1
Ladson Heights
$255,000
$290,000
$325,000
1,854
2,067
2,280
2004
2004
2004
2
Otranto Station
$185,000
$197,843
$225,000
1,012
1,072
1,352
1970
1970
1970
7
Felder Creek
$304,990
$355,741
$415,000
1,380
1,993
2,708
2006
2008
2014
14
Hidden Palms
$259,999
$282,833
$320,000
1,242
1,609
2,025
2002
2007
2014
3
Pirates Cove
$790,000
$790,000
$790,000
1,707
1,707
1,707
1987
1987
1987
1
Cannonborough
$449,000
$1,393,167
$2,200,000
637
1,797
2,850
1840
1903
2004
6
Colonial Heights
$175,000
$271,300
$320,000
1,231
1,473
1,634
1940
1969
1999
3
Presidential Estates
$242,680
$263,840
$285,000
1,528
1,604
1,680
2000
2001
2002
2
Myers Mill
$298,500
$363,674
$410,000
1,569
2,270
2,984
2006
2011
2021
8
Spinnaker Beachouse
$950,000
$950,000
$950,000
1,664
1,664
1,664
1978
1978
1978
1
Tides IV Condominiums
$1,475,000
$1,514,000
$1,565,000
1,800
1,900
2,200
2016
2016
2016
5
Hampton Park Terrace
$785,000
$1,518,667
$2,100,000
800
2,039
2,681
1914
1929
2022
12
Marsh Harbor
$1,295,000
$1,987,857
$3,175,000
1,814
2,499
4,200
1985
1993
2007
7
Pines at Gahagan
$429,000
$483,917
$540,000
1,878
2,454
3,019
2013
2015
2018
6
Rowland
$175,000
$175,000
$175,000
0
0
0
1
Aichele Terrace
$150,000
$253,600
$325,000
0
1,023
1,591
1958
1966
1985
5
Mira Vista
$284,999
$382,100
$420,000
718
1,092
1,416
2001
2001
2001
10
Martins Point
$1,750,000
$2,222,500
$2,695,000
3,149
3,492
3,835
1993
1994
1994
2
Quail Arbor
$269,000
$350,170
$470,000
1,196
1,800
2,558
1962
1977
1987
10
Berkeley Country Club
$7,500
$221,544
$720,000
0
781
2,400
1971
1984
2000
9
Rantowles
$795,000
$795,000
$795,000
0
0
0
1
St Thomas Point
$525,000
$767,600
$899,000
1,838
3,401
6,344
1994
1998
2001
5
Indian Springs
$240,000
$306,571
$425,000
1,055
1,527
1,987
1987
1995
2001
7
Foxborough Town Houses
$199,500
$199,500
$199,500
1,250
1,250
1,250
1978
1978
1978
1
The Commons at Fenwick Hall
$415,000
$440,000
$499,999
1,641
1,735
1,913
2012
2015
2021
4
Cameron Terrace
$455,000
$482,500
$520,000
1,080
1,427
1,944
1955
1957
1959
4
Gadsdenboro
$615,000
$1,006,656
$1,350,000
714
1,113
1,507
2006
2017
2018
9
Oakridge Estates
$205,000
$205,000
$205,000
1,274
1,274
1,274
1957
1957
1957
1
Plantation Ridge
$270,000
$270,000
$270,000
1,350
1,350
1,350
1984
1984
1984
1
Oak Terrace Preserve
$465,000
$639,433
$779,900
1,200
1,970
2,790
2007
2015
2018
9
Woodbury Park
$550,000
$572,000
$585,000
2,345
2,380
2,404
2019
2020
2020
4
Bonneau Village
$150,000
$225,633
$328,900
960
1,417
1,850
1979
1989
2005
3
Barony Ridge
$275,000
$289,960
$309,900
1,140
1,330
1,588
1986
1987
1988
5
Goodyear Estates
$1,250,000
$1,250,000
$1,250,000
2,925
2,925
2,925
2017
2017
2017
1
Quail Crossing
$350,000
$350,000
$350,000
2,128
2,128
2,128
2004
2004
2004
1
Hillsboro
$90,000
$90,000
$90,000
0
0
0
2
Chaparral Ranches
$115,000
$347,100
$624,900
0
1,661
2,652
1954
1977
2004
7
Bee Street Lofts
$465,000
$688,475
$825,000
951
1,586
2,030
2007
2007
2007
8
New Valley Acres
$685,000
$685,000
$685,000
2,428
2,428
2,428
2008
2008
2008
1
Edgewood
$429,000
$764,500
$1,100,000
1,316
1,834
2,352
2015
2018
2020
2
The Groves of Berkeley
$364,990
$452,382
$556,717
1,663
2,709
3,227
2014
2024
2024
24
Rivers Bend
$199,000
$219,667
$245,000
576
653
734
1966
1966
1966
3
10 Mile
$1,755,000
$1,755,000
$1,755,000
0
0
0
1
Shannon
$259,900
$259,900
$259,900
1,240
1,240
1,240
1979
1979
1979
1
Fleming Park
$659,900
$669,950
$680,000
1,848
1,848
1,848
2017
2017
2017
2
Hobcaw Creek Plantation
$895,000
$1,280,889
$1,695,000
2,404
3,230
4,160
1990
1993
2000
9
Berkeley Commons
$300,000
$325,833
$350,000
1,188
1,736
2,202
2004
2005
2005
3
Pelican Cove
$215,000
$215,000
$215,000
942
942
942
1983
1983
1983
1
Whitney Lake
$412,500
$524,087
$679,000
1,616
1,943
2,670
2006
2012
2019
27
Two Cedar Plantation
$289,000
$294,000
$299,000
0
0
0
2
Arcady Woods
$150,000
$191,000
$300,000
0
0
0
5
Meggett Place
$132,000
$133,500
$135,000
0
0
0
2
Ravenel Acres
$40,000
$40,000
$40,000
0
0
0
1
Ardmore
$80,000
$406,977
$689,900
0
1,288
2,142
1950
1976
2024
9
Harleyville
$140,000
$277,500
$415,000
0
1,436
2,872
1960
1960
1960
2
Mauss Hill
$239,000
$239,000
$239,000
0
0
0
1
Loyal Acres III
$55,000
$61,500
$69,500
0
0
0
3
Moss Pointe
$30,000
$164,500
$299,000
0
786
1,572
1987
1987
1987
2
Pineville
$10,000
$57,375
$132,000
0
371
1,485
1925
1925
1925
4
Pooshee Estates
$70,000
$177,800
$315,000
0
884
2,123
1996
2002
2009
5
Palmetto Terrace
$25,000
$32,000
$39,000
0
0
0
2
Osprey Cove
$350,000
$350,000
$350,000
0
0
0
1
Liberty Hill
$265,000
$418,333
$855,000
0
1,241
2,995
1950
1983
2017
6
Botany Bay
$639,500
$639,500
$639,500
1,850
1,850
1,850
1974
1974
1974
1
Atrium Villas
$740,000
$842,667
$959,000
1,080
1,080
1,080
1986
1993
2008
3
Montague Plantation
$259,000
$259,000
$259,000
1,459
1,459
1,459
2017
2017
2017
1
Summer Ridge
$386,000
$422,500
$459,000
1,898
1,938
1,977
2002
2003
2004
2
Hamlin Plantation
$425,000
$1,163,668
$2,300,000
0
2,670
4,237
2001
2007
2017
31
Taylor Farms
$317,500
$342,655
$365,565
1,482
1,482
1,482
2022
2022
2023
3
Montclair
$345,000
$385,264
$425,000
1,010
1,117
1,440
1985
1985
1985
11
Dunmovin
$230,000
$300,998
$389,990
912
1,090
1,186
1963
1966
1968
5
The Groves
$1,400,000
$2,254,750
$3,999,000
0
2,984
5,889
1952
1970
2024
8
Haynesville
$26,000
$78,667
$135,000
0
0
0
3
Silver Hill
$98,000
$383,000
$799,000
0
980
2,442
1984
2004
2024
4
Ashleytowne Village
$199,000
$258,812
$405,000
908
1,230
1,940
1982
1983
1984
17
Waterway South
$390,000
$394,500
$399,000
1,400
1,400
1,400
1985
1986
1986
2
Melrose
$370,000
$526,875
$949,000
0
1,571
2,296
1958
1971
1993
8
Colonial Pines
$344,900
$344,900
$344,900
1,600
1,600
1,600
1991
1991
1991
1
Churchill Landing
$1,750,000
$1,750,000
$1,750,000
7,134
7,134
7,134
2011
2011
2011
1
Fenwick Hills
$309,771
$428,537
$619,999
960
1,289
1,767
1958
1976
2017
7
Brookhaven
$249,990
$297,698
$345,000
1,002
1,340
1,701
1998
1999
2000
5
Parsonage Point
$160,000
$203,992
$347,000
0
803
1,099
1980
1980
1980
12
Boykin Creek
$515,000
$602,300
$769,000
2,231
2,838
3,600
2004
2005
2006
3
Mckenzie
$62,500
$62,500
$62,500
980
980
980
1993
1993
1993
1
Concord
$317,500
$317,500
$317,500
893
893
893
1999
1999
1999
1
Landsdowne
$440,000
$440,000
$440,000
1,118
1,118
1,118
1972
1972
1972
1
Shell Point
$625,000
$1,578,833
$2,475,000
1,286
2,850
4,500
1965
1988
2016
6
Hemmingwood
$385,000
$385,000
$385,000
1,300
1,300
1,300
1989
1989
1989
1
Meridian Place
$350,000
$408,345
$432,000
1,086
1,134
1,278
2002
2002
2003
11
One Cool Blow
$538,000
$538,000
$538,000
1,214
1,214
1,214
2008
2008
2008
1
Berkeley Hills
$300,000
$357,350
$465,000
1,162
1,602
2,772
1940
1961
1974
8
Moss Grove
$400,000
$400,000
$400,000
2,616
2,616
2,616
2017
2017
2017
1
The Arbor
$170,000
$170,000
$170,000
1,143
1,143
1,143
1980
1980
1980
1
St James Estates
$255,000
$335,545
$440,000
1,215
1,558
1,908
1972
1979
1993
11
Victoria Pointe
$380,000
$408,748
$450,000
2,098
2,427
2,698
2012
2013
2013
4
Beresford Creek Landing
$450,000
$1,241,082
$1,500,000
0
3,146
4,009
2003
2012
2019
11
Riverview Estates
$585,000
$619,667
$639,000
2,448
2,470
2,512
2020
2020
2021
3
Strawberry Station
$335,000
$373,999
$420,000
1,586
1,985
2,916
2016
2020
2022
11
Avondale
$879,900
$1,449,843
$2,599,000
1,962
2,794
4,206
1945
1967
2023
7
Asheford Place at Canterbury Woods
$439,900
$491,633
$550,000
1,552
1,677
1,850
1997
1997
1997
3
Wakendaw Lakes
$675,000
$1,072,700
$1,595,000
1,735
2,282
3,003
1969
1976
1986
7
Village Creek
$395,000
$426,667
$485,000
1,060
1,060
1,060
1981
1981
1981
3
The Glen at Summerset
$270,000
$333,669
$359,900
1,311
1,897
2,347
2006
2007
2010
7
Coopers Landing
$649,990
$717,997
$775,000
1,714
2,022
2,343
1986
1986
1986
3
Eagle Point
$335,000
$350,000
$380,000
1,277
1,481
1,886
1999
1999
1999
3
Oakland
$325,000
$404,980
$490,000
0
1,062
1,512
1960
1966
1983
5
Lakewood at The Lakes
$310,000
$310,000
$310,000
1,264
1,264
1,264
2000
2000
2000
1
Waterside Landing
$305,000
$339,667
$375,000
1,518
1,946
2,309
2007
2009
2010
3
Salt Marsh
$1,135,000
$1,267,500
$1,400,000
2,036
2,279
2,522
2011
2015
2018
2
St James III
$225,000
$280,000
$335,000
1,286
1,484
1,683
1975
1981
1987
2
River Glen
$580,000
$665,000
$750,000
2,641
2,962
3,300
2020
2021
2022
3
Center Park
$1,550,000
$1,550,000
$1,550,000
3,227
3,227
3,227
2003
2003
2003
1
Harbor Oaks
$427,900
$443,450
$459,000
1,270
1,361
1,452
1987
1987
1987
2
Green Acres
$429,000
$539,000
$739,000
1,040
1,785
2,340
1945
1956
1973
3
Geddes Hall
$369,000
$616,988
$875,000
1,200
1,683
2,695
1946
1967
1995
8
Stafford Heights
$415,000
$458,333
$489,999
1,000
1,289
1,458
1957
1960
1965
3
West Ashley Plantation
$349,000
$455,938
$574,000
1,100
1,722
2,610
1961
1968
1973
8
Dominion Hills
$419,900
$620,671
$1,199,999
1,800
2,236
2,525
1968
1974
1979
7
Knightsville Farms
$179,853
$179,853
$179,853
0
0
0
1
Charleston Chase
$342,000
$353,500
$365,000
2,120
2,354
2,588
2014
2016
2017
2
West Oak Forest
$350,000
$559,711
$662,400
1,000
1,623
2,130
1950
1960
1973
9
Brownswood Place
$321,700
$359,100
$409,000
1,116
1,150
1,186
2008
2008
2009
4
Oakbrook Commons
$255,000
$259,380
$265,000
1,120
1,153
1,267
2001
2001
2002
5
Sea Island Farms
$575,000
$591,600
$599,900
2,404
2,436
2,456
2017
2017
2017
3
Tranquil Hill Plantation
$260,000
$306,930
$349,500
1,500
2,333
2,617
2006
2009
2017
10
Regency West Villas
$314,900
$314,900
$314,900
940
940
940
1970
1970
1970
1
Marsh Island Woods 427
$335,000
$785,000
$1,785,000
0
518
2,070
1986
1986
1986
4
South Riverview
$529,000
$529,000
$529,000
1,425
1,425
1,425
1961
1961
1961
1
Brookgreen Meadows
$975,000
$2,879,333
$6,295,000
1,720
2,261
2,647
2015
2016
2016
3
Patriots Plantation
$675,000
$767,667
$889,000
2,000
2,421
2,876
2000
2000
2001
3
Whitehouse Plantation
$319,900
$534,483
$710,000
1,188
1,526
2,016
1964
1972
1984
6
Coventry Place
$255,000
$255,000
$255,000
1,440
1,440
1,440
1985
1985
1985
1
Woodbridge
$169,000
$244,333
$299,000
0
1,069
1,750
1985
1991
1996
3
Marlin Estates
$299,000
$349,800
$430,000
1,432
1,673
2,200
1990
1995
1996
6
Simmons Pointe
$875,000
$987,500
$1,100,000
1,768
1,822
1,877
1985
1988
1991
2
Shell Landing
$1,395,000
$1,395,000
$1,395,000
2,986
2,986
2,986
2021
2021
2021
1
254 Seven Farms Drive
$329,999
$404,040
$500,000
756
991
1,225
2005
2005
2005
10
Lakeshore Commons
$1,150,000
$1,150,000
$1,150,000
2,522
2,522
2,522
1994
1994
1994
1
Coosaw Preserve
$375,000
$460,168
$568,595
1,969
2,805
3,677
2016
2017
2019
16
Hammocks
$194,900
$884,950
$1,575,000
0
1,465
2,930
2000
2000
2000
2
Church Creek Landing
$479,000
$862,000
$1,245,000
2,105
2,670
3,236
2019
2021
2022
2
Charleston Heights
$225,000
$225,000
$225,000
1,176
1,176
1,176
1940
1940
1940
1
Spring Grove
$299,900
$346,617
$425,000
1,490
1,944
2,742
2006
2011
2019
6
East Crossing
$575,000
$575,000
$575,000
1,288
1,288
1,288
1987
1987
1987
1
Woodland Estates
$320,000
$501,250
$600,000
1,875
2,321
2,800
1964
1983
2003
4
Highland Park
$219,000
$340,189
$389,900
0
1,418
2,055
1948
1987
2018
9
Ashland Plantation
$740,000
$1,106,250
$1,590,000
0
2,698
3,908
1988
1991
1993
4
Forest Acres
$315,000
$395,750
$475,000
1,075
1,441
1,820
1955
1961
1966
4
River Reach at Remleys Point
$2,500,000
$2,500,000
$2,500,000
3,847
3,847
3,847
2006
2006
2006
1
Harbour Watch
$839,000
$2,293,429
$4,450,000
0
3,094
5,044
1992
2000
2015
7
Patriots Province
$640,000
$731,800
$895,500
1,232
1,512
1,721
1983
1986
1992
3
Oakbrook Park
$244,990
$253,832
$264,000
1,317
1,321
1,334
2015
2016
2017
6
Yeamans Park 2
$259,000
$324,500
$425,000
1,134
1,390
1,586
1958
1965
1973
4
Calomet Valley
$45,000
$98,500
$152,000
0
257
514
1980
1980
1980
2
Otranto Club Villas III
$150,000
$170,000
$195,000
950
1,074
1,320
1984
1984
1985
3
Castlewood
$325,000
$325,000
$325,000
912
912
912
1958
1958
1958
1
Tibwin Forest
$99,500
$99,500
$99,500
0
0
0
1
Indigo Hall at Hope Plantation
$363,000
$560,714
$800,000
0
996
1,858
2004
2008
2012
7
Whaley And Seabrook
$1,399,900
$1,399,900
$1,399,900
0
0
0
1
Northbridge Terrace
$499,000
$623,711
$799,995
1,459
1,865
2,119
1958
1964
1974
9
Linkside Villas
$1,075,000
$1,075,000
$1,075,000
1,620
1,620
1,620
1984
1984
1984
1
Lakeside
$425,000
$582,486
$675,000
1,193
2,273
2,773
1983
2012
2017
8
Buckhorn II
$39,000
$184,450
$329,900
0
1,033
2,066
1999
1999
1999
2
Edentree Place
$715,000
$715,000
$715,000
2,420
2,420
2,420
2014
2014
2014
1
Plantation Point
$290,000
$321,400
$357,000
1,248
1,580
1,806
1987
1996
1999
5
Cottages at Copahee
$785,000
$785,000
$785,000
2,576
2,576
2,576
2017
2017
2017
1
Ashley Park
$350,000
$386,738
$410,000
1,456
1,540
1,772
2005
2012
2017
8
Cambridge Lakes
$405,000
$443,475
$500,000
1,165
1,265
1,347
2000
2000
2000
4
Cypress Grove
$369,900
$374,725
$380,000
2,041
2,195
2,269
2017
2018
2020
4
West Point
$575,000
$575,000
$575,000
1,110
1,176
1,243
1990
1990
1990
2
Island Estates
$450,000
$521,250
$575,000
1,116
1,332
1,896
1974
1996
2004
4
Fireside
$200,000
$210,667
$217,000
1,080
1,080
1,080
1985
1985
1985
3
Hunt Club
$380,000
$470,000
$689,999
1,486
2,009
2,904
2003
2009
2013
6
Stoney Creek
$280,000
$327,108
$355,000
1,182
1,751
2,382
2007
2012
2017
12
Bedford Chase
$410,000
$410,000
$410,000
2,462
2,462
2,462
1998
1998
1998
1
Sedgefield Townhouses
$193,000
$195,683
$198,750
1,024
1,039
1,046
1985
1985
1985
3
Chesterfield
$550,000
$550,000
$550,000
1,521
1,521
1,521
1965
1965
1965
1
Pinckney Place
$1,195,000
$1,197,500
$1,200,000
3,240
3,322
3,403
2008
2009
2009
2
Pt Capes Plantation
$998,000
$998,000
$998,000
2,133
2,133
2,133
1994
1994
1994
1
Bakers Landing
$1,250,000
$1,250,000
$1,250,000
4,894
4,894
4,894
2004
2004
2004
1
Gadsden Acres
$350,000
$579,933
$739,900
1,989
2,322
2,745
1983
1987
1990
3
George And Society
$1,070,000
$1,070,000
$1,070,000
1,224
1,224
1,224
2007
2007
2007
1
Forest Lakes Extension
$440,000
$516,625
$599,000
1,593
1,947
2,126
1988
1990
1992
4
Brandymill
$239,900
$313,379
$375,000
1,214
1,557
2,032
1984
1987
1992
10
Ponderosa
$285,000
$388,700
$449,500
1,334
1,474
1,632
1969
1987
2006
5
Home Farm
$3,490,000
$3,490,000
$3,490,000
4,222
4,222
4,222
2002
2002
2002
1
Radcliffe Place
$299,000
$299,000
$299,000
1,578
1,578
1,578
2004
2004
2004
1
Foreston Farms
$300,000
$300,000
$300,000
1,568
1,568
1,568
2006
2006
2006
1
Rivertowne Country Club
$720,000
$1,283,234
$2,900,000
2,214
3,157
5,873
2001
2008
2024
19
Emma Lane Townes
$650,000
$650,000
$650,000
2,295
2,295
2,295
2020
2020
2020
1
Pineland Heights
$160,000
$215,186
$238,900
1,024
1,265
1,447
1984
1999
2004
15
Carolina Walk
$779,000
$830,500
$899,000
2,234
2,287
2,446
2015
2015
2015
4
Providence Commons
$512,000
$563,565
$587,500
2,224
2,540
2,786
1997
2001
2004
6
Chaparral
$125,000
$388,653
$750,000
0
1,226
2,100
1982
2009
2024
9
Magnolia Pointe
$343,990
$420,456
$455,695
1,829
2,291
2,591
2023
2024
2024
15
Knightsville
$475,000
$475,000
$475,000
1,933
1,933
1,933
1985
1985
1985
1
Watermark
$495,000
$1,447,667
$2,100,000
0
2,572
3,846
2010
2015
2020
9
Linnen Place
$599,000
$672,250
$725,000
1,560
2,072
2,337
2010
2012
2013
4
Long Grove
$325,000
$428,986
$550,000
786
1,075
1,197
1999
1999
2000
7
Pineview Hills
$175,000
$267,733
$359,900
945
1,237
1,887
1964
1966
1968
6
Greenwood Park
$375,000
$426,000
$475,000
1,268
1,371
1,512
1968
1969
1971
5
Beachfront
$585,000
$1,706,750
$2,985,000
0
1,814
3,600
1970
1989
2021
8
Scotch Range
$250,000
$477,760
$720,000
0
2,168
4,225
1984
1992
1998
5
Cassique
$900,000
$4,159,000
$5,500,000
0
3,270
4,623
2005
2014
2022
5
Creek Point
$525,000
$577,750
$626,000
0
1,302
2,279
1984
1986
1987
4
North Pointe
$285,000
$292,495
$299,990
1,100
1,375
1,650
1987
1988
1989
2
Huntington Woods
$479,000
$1,026,000
$2,250,000
1,294
2,460
3,735
1956
1970
1978
4
Corey Gardens
$240,000
$250,000
$260,000
1,434
1,434
1,434
2000
2000
2000
2
Moss Park
$850,000
$882,475
$900,000
0
1,676
2,529
1964
1965
1966
4
The Colony at Heron Reserve
$265,000
$301,714
$359,999
964
1,250
1,564
2006
2006
2006
7
Cambridge Park
$379,000
$407,250
$445,000
1,866
2,508
3,135
2020
2020
2021
4
Oak View Park
$227,000
$228,500
$230,000
0
0
0
2
Bentley Park
$975,000
$975,000
$975,000
2,312
2,312
2,312
2020
2020
2020
1
Countryside Townhomes
$187,000
$193,166
$199,500
997
997
997
1980
1980
1980
3
Harborgate Shores
$650,000
$888,167
$1,095,000
1,454
1,765
2,236
1974
1978
1989
6
Northwoods Estates
$226,000
$275,500
$325,000
1,561
1,570
1,579
1972
1983
1993
2
Russelldale
$165,000
$235,800
$300,000
954
1,128
1,522
1950
1959
1988
5
Clarkson
$70,000
$70,000
$70,000
0
0
0
1
Summerville Heights
$260,000
$260,000
$260,000
1,027
1,027
1,027
1964
1964
1964
1
Courtland Square
$165,000
$173,500
$185,500
800
801
801
1966
1967
1970
3
Gavin Estates
$267,500
$391,250
$515,000
1,500
1,825
2,150
2001
2012
2023
2
Fenwick Woods
$550,000
$647,167
$820,000
2,349
2,800
4,216
2015
2016
2017
6
Briddleford Ridge
$265,000
$306,140
$380,000
1,105
1,387
2,080
1980
1990
2003
7
Mallard Crossing
$273,000
$335,562
$407,500
1,428
1,906
2,807
2020
2021
2022
16
Lafayette Park
$99,000
$164,000
$229,000
1,056
1,483
1,910
1990
1991
1992
2
Cokers Crossing
$320,000
$353,874
$408,000
1,424
1,846
2,579
2004
2007
2011
8
Wando East
$374,900
$485,150
$699,000
1,168
1,425
2,120
1980
1983
1987
6
The Landings
$114,900
$117,450
$120,000
0
0
0
2
Midtown
$800,000
$1,154,709
$1,399,000
1,760
2,617
3,359
2008
2018
2021
11
Myrtle Grove
$390,000
$407,500
$425,000
1,014
1,026
1,038
1960
1962
1963
2
Quigley Farms
$650,000
$908,750
$1,450,000
0
1,708
2,754
1976
1990
2002
4
Marsh Hall
$345,000
$420,000
$465,000
2,395
2,488
2,540
2001
2002
2003
3
West Greenview Acres
$40,000
$263,969
$365,000
0
1,087
1,475
1965
1983
2024
7
Heritage Village
$390,000
$499,211
$575,000
1,120
1,340
1,408
1974
1974
1974
9
Cain Crossing
$405,000
$427,571
$500,000
1,644
1,774
2,326
2009
2013
2015
7
Pinewood Vista
$185,000
$255,000
$325,000
1,329
1,657
1,985
1947
1950
1952
2
Beresford Pointe
$3,200,000
$3,200,000
$3,200,000
3,453
3,453
3,453
2010
2010
2010
1
Tarpon Pond Cottages
$639,000
$732,000
$825,000
1,250
1,400
1,550
1977
1977
1977
2
Jasper Terrace
$790,000
$1,238,000
$1,925,000
936
1,323
1,976
1957
1957
1958
3
Edgewood Gardens
$425,000
$475,000
$525,000
1,000
1,174
1,349
1955
1959
1962
2
Greenslake Condominiums
$150,000
$189,984
$212,000
1,148
1,184
1,498
1983
1986
2004
19
Tupelo
$614,000
$721,056
$899,000
1,341
2,455
3,704
2013
2014
2016
9
Middleton Oaks
$395,000
$895,000
$1,395,000
0
1,867
3,734
1992
1992
1992
2
Appian Landing
$289,000
$391,594
$499,000
1,458
1,814
2,422
1985
1989
1992
8
Oceanwood
$1,995,000
$1,995,000
$1,995,000
1,355
1,355
1,355
1978
1978
1978
1
Bolen Point Plantation
$50,000
$50,000
$50,000
0
0
0
1
Pierpont
$275,000
$810,744
$2,999,999
0
1,349
3,383
1940
1979
2023
16
Mepkin Place
$160,000
$208,000
$230,000
936
975
1,008
1975
1975
1975
6
West Highland Acres
$650,000
$650,000
$650,000
2,957
2,957
2,957
1982
1982
1982
1
Sandpiper Pointe
$439,000
$494,667
$550,000
965
1,225
1,606
1985
1986
1987
3
Jacobs Cove
$319,900
$324,950
$330,000
1,715
1,864
2,014
2014
2014
2014
2
Tranquil Acres
$199,900
$304,580
$375,000
0
1,483
2,213
1965
1972
1987
5
Mallard Lakes
$575,000
$647,667
$749,000
1,464
1,516
1,559
1986
1986
1986
3
Grove Plantation
$465,000
$562,000
$659,000
0
832
1,664
1997
1997
1997
2
Oak Leaf Estates
$150,000
$172,250
$185,000
724
928
1,028
1985
1988
1990
4
Pinegrove Acres
$199,000
$199,000
$199,000
1,728
1,728
1,728
1997
1997
1997
1
Gin Pond
$289,900
$569,900
$849,900
1,489
1,973
2,457
1987
1989
1991
2
Lawton Harbor
$569,000
$668,580
$725,000
1,755
1,993
2,233
2001
2002
2004
5
Varn
$35,000
$160,975
$249,900
850
1,204
1,533
1947
1966
1992
4
Ashleyville
$70,000
$279,850
$489,700
0
626
1,252
2023
2023
2023
2
Longbranch
$350,000
$433,000
$550,000
1,594
1,870
2,040
1949
1966
1983
3
Heathwood Villas
$350,000
$350,000
$350,000
1,419
1,419
1,419
1970
1970
1970
1
Canterbury Woods
$332,000
$418,129
$475,000
1,059
1,600
1,996
1985
1988
1991
7
Tupelo Plantation
$535,000
$704,000
$850,000
1,500
2,374
3,071
2013
2014
2017
8
Walnut Farms
$510,000
$694,750
$900,000
2,255
3,422
4,553
1990
1997
2005
4
Harbor Woods III
$575,000
$725,000
$875,000
1,536
2,094
2,652
1988
1990
1991
2
Timber Trace
$442,000
$455,400
$475,000
2,635
2,774
2,948
2019
2020
2021
5
St. Johns Lake
$496,210
$617,156
$775,000
1,748
2,485
3,600
2017
2022
2024
16
Sol Legare
$275,000
$443,833
$575,000
0
520
1,561
1953
1953
1953
3
Park Circle Station
$484,000
$484,000
$484,000
2,160
2,160
2,160
2021
2021
2021
1
Sophia Landing
$285,000
$367,987
$425,000
1,128
2,042
2,766
2011
2015
2018
8
Daniels Landing
$329,900
$429,077
$595,000
638
1,003
1,440
1999
2000
2000
9
Sol Legare Preserve
$824,900
$832,450
$840,000
2,064
2,081
2,098
2019
2019
2019
2
Wildwood Town Homes
$270,000
$278,750
$287,500
898
898
898
1978
1978
1978
2
Bamboo Forest
$690,000
$690,000
$690,000
2,438
2,438
2,438
1986
1986
1986
1
Woodcreek Lake
$650,000
$650,000
$650,000
4,231
4,231
4,231
2021
2021
2021
1
Little Oak
$435,000
$567,000
$699,000
938
1,098
1,258
1983
1983
1983
2
Kings Flats
$605,000
$737,000
$869,000
1,833
2,004
2,176
2019
2019
2019
2
General Moultrie
$375,000
$456,333
$499,000
0
684
2,052
1984
1984
1984
3
St Johns Crossing
$495,000
$523,500
$565,000
1,209
1,657
1,900
2008
2011
2013
7
Crowfield Village
$210,000
$217,500
$225,000
1,056
1,096
1,136
1986
1986
1986
2
Longford Place Plantation
$320,000
$349,125
$369,000
1,640
1,992
2,366
2003
2004
2004
4
Okatee
$264,500
$283,167
$295,000
1,244
1,376
1,620
1977
1979
1980
3
Mouzons Bluff
$429,000
$852,000
$1,275,000
763
766
768
2007
2015
2023
2
Quail Hill
$274,900
$305,467
$350,000
1,192
1,356
1,700
2005
2006
2008
6
Gadsden Manor
$725,000
$828,750
$995,000
2,373
2,715
3,160
1982
1988
1992
4
Pinopolis
$499,999
$579,950
$659,900
2,096
2,234
2,373
1968
1992
2016
2
Oak Hill Plantation
$299,800
$340,856
$405,000
1,432
1,978
2,712
2003
2004
2005
9
Pimlico West
$475,000
$497,450
$519,900
1,727
2,014
2,302
2003
2010
2016
2
North Cameron Terrace
$399,000
$586,725
$895,000
1,380
1,828
2,800
1958
1959
1960
4
Midland Terrace
$199,900
$223,086
$249,890
712
995
1,109
2001
2001
2001
8
Downtown
$339,900
$1,208,800
$3,485,000
822
1,489
4,008
1800
1923
2008
16
Queensborough
$499,000
$561,500
$645,000
1,230
1,588
1,869
1966
1974
1981
6
Skippers Point
$700,000
$749,500
$799,000
0
1,352
2,704
2003
2003
2003
2
Hollywood Manor
$74,900
$266,800
$375,500
0
1,353
2,400
2003
2004
2005
3
Stono Park
$435,000
$733,725
$1,200,000
1,206
1,874
2,560
1949
1976
2022
4
Brook Valley
$275,000
$275,000
$275,000
1,232
1,232
1,232
2017
2017
2017
1
Cove Inlet Villas
$525,000
$525,000
$525,000
1,080
1,161
1,226
1978
1981
1982
3
Shaftesbury
$235,000
$327,500
$420,000
900
1,360
1,820
1966
1976
1986
2
Land-O-Pines
$439,000
$516,580
$790,000
1,847
2,352
2,800
1970
1973
1975
5
Fox Pond
$675,000
$744,333
$849,000
1,322
1,530
1,662
1983
1984
1984
3
Wappoo Heights
$1,190,000
$1,190,000
$1,190,000
2,998
2,998
2,998
1960
1960
1960
1
Tremont
$430,000
$440,000
$450,000
1,254
1,513
1,772
2006
2006
2006
2
Oyster Bluff
$477,500
$488,800
$499,900
2,826
3,111
3,254
2017
2017
2017
3
The Ponderosa
$365,000
$365,000
$365,000
1,314
1,314
1,314
1966
1966
1966
1
The Gates of Fenwick Plantation
$335,000
$402,500
$560,000
1,397
1,712
2,408
2002
2009
2020
4
Bee Hive Plantation
$498,000
$1,489,500
$3,000,000
0
729
2,243
2004
2005
2005
5
Chisolm Green
$715,000
$1,957,500
$3,200,000
2,769
3,284
3,800
1980
1992
2003
2
Palmetto Row
$290,000
$290,000
$290,000
1,604
1,604
1,604
2019
2019
2019
1
Indigo Place
$288,999
$294,000
$299,000
1,200
1,228
1,256
1985
1987
1988
2
Flowertown
$235,000
$249,780
$274,900
1,032
1,158
1,427
1971
1974
1976
5
Harbor Woods
$625,000
$800,000
$975,000
1,554
2,389
3,230
1973
1986
2014
4
Fort Lamar
$600,000
$980,600
$1,275,000
1,756
2,401
2,662
1971
2003
2024
5
Hunters Trace
$329,000
$389,500
$450,000
1,106
1,182
1,258
1983
1983
1983
2
Ashley Hall Manor
$375,000
$504,114
$649,900
1,278
1,576
2,775
1960
1962
1963
7
Cypress Bluff Estates
$215,000
$215,000
$215,000
0
0
0
1
Royal Oaks
$305,000
$971,500
$3,000,000
1,322
2,240
3,468
2010
2013
2017
6
New Parrish Village
$899,999
$1,009,750
$1,150,000
1,760
2,118
2,512
2005
2005
2006
4
Grand Oaks Townhomes
$345,000
$360,000
$375,000
1,240
1,280
1,320
2007
2008
2008
2
Jenkins Terrace
$324,900
$324,900
$324,900
1,387
1,387
1,387
1960
1960
1960
1
Landry Farms
$864,000
$1,231,000
$1,598,000
2,106
3,162
4,217
2008
2014
2019
2
Stono Pointe
$899,000
$1,583,000
$2,395,000
0
2,265
3,560
2001
2013
2024
3
Hickory Shadows
$800,000
$875,000
$949,999
1,314
2,382
3,450
1978
1985
1992
2
Hunley Waters
$585,000
$590,000
$595,000
1,828
1,838
1,848
2013
2014
2014
2
The Village at Stiles Point
$1,155,000
$1,270,000
$1,350,000
3,047
3,662
4,200
2017
2019
2019
4
College Park Duplexes
$175,000
$220,996
$288,000
892
1,094
1,484
1986
1989
2016
12
Charlestowne Est
$475,000
$547,633
$615,000
1,613
1,873
2,378
1960
1963
1965
6
Carlton Place
$379,000
$395,500
$430,000
1,400
1,746
2,128
2007
2009
2010
4
Westminster Heights
$344,999
$344,999
$344,999
1,757
1,757
1,757
2002
2002
2002
1
Rice Hope
$675,000
$700,000
$725,000
1,836
2,240
2,644
1984
1999
2013
2
The Refuge at Whitehall
$525,000
$723,700
$999,900
2,342
3,496
4,965
2004
2008
2017
4
Horlbeck Creek
$679,900
$1,097,467
$1,700,000
2,004
2,612
3,085
1995
1998
1999
6
One Belle Hall
$445,000
$473,614
$500,000
1,051
1,273
1,512
2006
2006
2006
7
Ashley Hills
$229,900
$261,725
$300,000
1,039
1,212
1,450
1992
2001
2006
4
Royal Palms
$515,000
$525,800
$545,000
1,752
2,221
2,527
2007
2012
2016
5
Fox Field
$10,000
$97,600
$209,000
0
715
1,792
1995
1999
2003
5
Hambersham
$1,475,000
$1,475,000
$1,475,000
2,447
2,447
2,447
2013
2013
2013
1
Church Creek
$410,000
$495,065
$690,425
1,312
1,853
2,441
1966
1981
2024
5
Bel Air
$199,000
$376,333
$520,000
1,116
1,508
1,916
1963
1978
1986
3
Orange Grove
$325,000
$325,000
$325,000
0
0
0
1
B Hill
$75,000
$75,000
$75,000
0
0
0
1
Porchers Bluff
$4,700,000
$4,700,000
$4,700,000
4,000
4,000
4,000
2019
2019
2019
1
Barohay
$625,000
$625,000
$625,000
0
0
0
1
Boone Hall Plantation
$325,000
$325,000
$325,000
0
0
0
1
Hermitage
$500,000
$1,147,500
$1,795,000
0
1,513
3,026
1976
1976
1976
2
Howell/Lemacks
$259,000
$259,000
$259,000
1,342
1,342
1,342
1955
1955
1955
1
Chessee River
$22,500
$55,750
$89,000
0
0
0
2
Bear Swamp
$448,000
$448,000
$448,000
1,680
1,680
1,680
1970
1970
1970
1
Station View
$135,000
$135,000
$135,000
1,247
1,247
1,247
1958
1958
1958
1
Hopkinson Plantation
$699,000
$699,000
$699,000
0
0
0
1
Red Top
$1,900,000
$1,900,000
$1,900,000
0
0
0
1
Marshfield
$40,000
$40,000
$40,000
0
0
0
1
Jedburg
$1,250,000
$1,622,500
$1,995,000
0
0
0
2
Edward Ravenel Estates
$162,000
$162,000
$162,000
1,475
1,475
1,475
1940
1940
1940
1
Secessionville
$589,000
$1,012,934
$1,795,000
1,404
1,751
2,209
1956
1964
1976
5
Shell House
$135,000
$388,333
$750,000
0
0
0
3
Ferndale
$25,000
$258,311
$449,000
0
1,011
1,900
1950
1987
2024
9
Avalon In The Pines
$199,900
$262,450
$325,000
1,072
1,224
1,375
1960
1983
2006
2
Ravenel
$239,000
$319,000
$399,000
0
1,068
2,136
1965
1965
1965
2
Lakeshore Estates
$34,000
$39,500
$45,000
0
0
0
2
Legares
$1,093,500
$1,093,500
$1,093,500
0
0
0
1
Beehive
$175,000
$1,056,250
$3,700,000
0
0
0
4
Turkey Pen
$250,000
$250,000
$250,000
0
0
0
1
Summer Park
$325,000
$382,742
$440,000
1,658
2,412
3,190
2004
2006
2009
12
Alvin
$33,000
$114,405
$269,000
0
643
1,458
1972
1991
2002
6
Metts Acres
$199,000
$199,000
$199,000
836
836
836
1965
1965
1965
1
Hampton Drive
$16,900
$177,950
$339,000
0
1,007
2,014
1964
1964
1964
2
Bay Tree
$482,000
$552,825
$615,000
1,022
1,359
1,876
1973
1978
1981
7
Brookfield Square
$224,500
$227,250
$230,000
1,250
1,250
1,250
1984
1995
2006
2
Port Ocall
$784,900
$951,633
$1,175,000
800
956
1,267
1981
1982
1983
3
North Tranquil Acres
$295,000
$300,000
$305,000
1,417
1,908
2,399
1968
1972
1975
2
Pelican Watch Villa
$585,000
$585,000
$585,000
1,000
1,000
1,000
1981
1981
1981
1
Wando Lakes
$649,000
$689,500
$730,000
1,450
1,726
2,001
1986
1987
1987
2
Morris Square
$1,250,000
$1,272,500
$1,295,000
2,033
2,078
2,123
2014
2016
2018
2
Remington Forest
$470,000
$527,000
$555,000
1,100
1,251
1,314
1986
1986
1986
5
Sable On The Marsh
$550,000
$586,250
$615,000
1,648
1,675
1,684
2007
2010
2020
4
The Bristol
$850,000
$958,250
$1,195,000
1,468
1,675
2,038
2002
2002
2002
4
Foxborough
$310,000
$317,000
$325,000
1,274
1,361
1,528
1977
1978
1979
5
Edisto Recreational Park
$55,000
$224,725
$450,000
0
378
1,512
2002
2002
2002
4
Riverstone
$350,000
$360,000
$370,000
1,925
2,174
2,424
2019
2020
2020
2
Parkdale
$374,800
$1,404,900
$2,435,000
1,528
1,708
1,887
1956
1982
2008
2
Dunmeyer Hill Estates
$335,000
$335,000
$335,000
1,495
1,495
1,495
2023
2023
2023
1
Waterford
$330,000
$330,000
$330,000
1,052
1,052
1,052
1985
1985
1985
1
Koger Tract
$39,998
$77,499
$115,000
0
0
0
2
Parkshore
$699,000
$724,500
$750,000
2,150
2,371
2,592
1975
1975
1975
2
Laurel Hill Plantation
$365,000
$477,000
$589,000
0
0
0
2
Edisto River
$155,000
$155,000
$155,000
0
0
0
1
Woodhill Place
$167,000
$186,250
$203,900
895
1,006
1,238
1984
1985
1985
6
Bay Club Sea Lofts
$315,000
$376,400
$450,000
800
840
1,000
1987
1987
1987
5
Ashley Point
$209,000
$209,000
$209,000
0
0
0
1
Reserve at Mallard Crossing
$365,000
$384,667
$414,000
1,639
1,969
2,340
2022
2023
2023
3
Plantation at Stono Ferry
$169,000
$575,000
$1,350,000
0
955
2,864
2008
2008
2008
3
The Hamlet
$325,000
$791,667
$1,350,000
0
1,904
3,012
1981
1982
1982
3
Covington Hills
$199,000
$325,750
$395,000
1,348
1,676
2,400
1974
1977
1983
4
Chandler Village
$318,000
$359,000
$399,000
1,584
1,752
1,855
1987
1988
1989
3
Bellcrest Estates
$250,000
$250,000
$250,000
1,154
1,154
1,154
2010
2010
2010
1
Palmetto Estate
$209,900
$245,967
$269,000
1,250
1,338
1,430
1976
1980
1985
3
Pine Bluff
$279,000
$279,000
$279,000
1,219
1,219
1,219
1994
1994
1994
1
Cooper Estates
$589,000
$978,167
$1,500,000
1,440
2,072
3,185
1966
1979
2019
6
Bushy Park Terrace
$170,000
$278,975
$331,000
1,050
1,189
1,386
1968
1975
1984
4
The Pointe at Rhodes Crossing
$489,900
$547,467
$625,000
1,682
2,264
3,200
2018
2021
2023
6
Concord West of The Ashley
$272,000
$334,127
$425,000
621
910
1,221
1999
1999
1999
15
Murraywood
$304,999
$304,999
$304,999
1,116
1,116
1,116
2002
2002
2002
1
Simmons Terrace
$569,000
$572,000
$575,000
2,123
2,284
2,445
2001
2002
2002
2
Bay Pointe Villas
$399,900
$423,350
$439,500
708
708
708
1984
1984
1984
4
Willowbrook I
$235,000
$286,200
$339,000
1,042
1,412
1,681
1976
1980
1986
5
Citadel Woods
$425,000
$455,225
$487,000
1,290
1,450
1,588
1991
1993
1996
4
Pleasant Pines
$650,000
$662,500
$675,000
1,351
1,434
1,516
1965
1966
1966
2
Willow Walk
$439,000
$502,000
$535,000
1,188
1,382
1,572
1985
1986
1987
4
E F Street
$874,000
$877,000
$880,000
1,642
1,721
1,800
2022
2023
2023
2
Marlborough
$849,000
$925,000
$995,000
2,070
2,528
2,983
1973
1984
1992
5
Bay Village
$280,000
$402,500
$525,000
1,500
2,091
2,682
1998
2007
2016
2
Near Adams Run
$125,000
$125,000
$125,000
0
0
0
1
Accabee
$25,000
$274,863
$695,000
0
969
1,316
1930
1974
2024
8
Summerwood
$279,900
$289,300
$296,000
1,056
1,119
1,234
1986
1991
1999
3
Clearview
$598,896
$1,093,086
$2,990,000
1,640
2,485
3,800
1960
1970
1991
15
The Preserve
$213,728
$328,864
$444,000
0
1,030
2,060
2022
2022
2022
2
Ospery Pointe
$249,000
$249,000
$249,000
1,316
1,316
1,316
1997
1997
1997
1
Shilelagh Oaks Farms
$889,000
$889,000
$889,000
2,607
2,607
2,607
2003
2003
2003
1
Hyde Park
$243,000
$273,003
$329,500
1,016
1,403
1,933
1955
1975
2007
6
Shoreline Farms
$875,000
$875,000
$875,000
1,964
1,964
1,964
1997
1997
1997
1
Waring Hall
$280,000
$280,000
$280,000
1,450
1,450
1,450
1977
1977
1977
1
Brick Barn Pointe
$325,000
$325,000
$325,000
1,622
1,622
1,622
2005
2005
2005
1
Ridgeville Farms
$199,900
$278,300
$385,000
0
888
2,664
2008
2008
2008
3
Creekside Park
$1,195,000
$2,150,000
$3,500,000
2,466
3,241
3,955
1972
1975
1979
3
Palmetto Gardens
$425,000
$491,848
$574,990
777
1,191
1,374
1940
1946
1962
4
Phillips Creek
$950,000
$1,100,000
$1,250,000
3,060
3,378
3,696
2022
2022
2022
2
Forest Lakes
$400,000
$528,000
$655,000
1,543
2,095
2,722
1973
1975
1978
6
Fairwoods Estates
$124,900
$204,950
$285,000
1,792
1,904
2,016
2001
2001
2001
2
Bowen
$500,000
$622,000
$769,000
1,902
2,264
2,775
2019
2020
2022
7
Crosscreek
$574,900
$649,950
$749,900
1,261
1,750
2,835
1979
1982
1983
4
Haven Estates
$1,100,000
$1,100,000
$1,100,000
3,311
3,311
3,311
2024
2024
2024
1
Dawson Branch
$236,990
$268,895
$315,990
1,386
1,386
1,387
2024
2024
2024
37
Pavilion Watch
$995,000
$995,000
$995,000
1,352
1,352
1,352
2002
2002
2002
1
Clarks Point
$675,000
$692,500
$725,000
1,257
1,566
1,851
1964
1973
1994
4
Arboretum
$277,000
$310,225
$335,000
812
1,135
1,446
2007
2007
2007
8
Parker's Preserve
$340,490
$433,365
$512,355
1,893
2,520
3,051
2024
2024
2024
10
Green Park
$5,900
$10,525
$21,000
0
0
0
4
Paradise Acres
$449,000
$449,000
$449,000
1,612
1,612
1,612
1998
1998
1998
1
Boyle Plantation
$235,000
$317,450
$399,900
0
0
0
2
Lee Jackson Place
$549,900
$549,900
$549,900
1,432
1,432
1,432
1996
1996
1996
1
South Windermere
$899,000
$1,298,875
$2,000,000
1,566
2,583
3,807
1953
1961
1986
8
Ashley Heights
$240,000
$331,633
$455,000
1,453
1,813
2,155
1960
1982
2024
3
Archfield Plantation
$235,000
$591,000
$1,189,000
0
819
2,456
2024
2024
2024
3
Islands of Beaufort
$52,000
$52,000
$52,000
0
0
0
1
Mitten Park & Terrace
$45,000
$417,780
$1,150,000
0
1,844
4,500
1926
1967
2019
5
Hickory Hill
$299,000
$431,000
$750,000
0
882
2,388
2000
2009
2017
4
Laurens Place
$997,995
$1,929,332
$3,295,000
2,301
2,440
2,509
2000
2000
2000
3
Willow Oaks
$300,000
$300,000
$300,000
1,430
1,430
1,430
2007
2007
2007
1
Ashleytowne Landing
$410,000
$442,667
$493,000
1,515
1,741
1,984
1981
1982
1983
3
Island Bluff
$310,000
$315,000
$320,000
1,194
1,194
1,194
1985
1985
1985
2
Arlington at Parkwest
$775,000
$775,000
$775,000
3,035
3,035
3,035
2001
2001
2001
1
Westborough
$395,000
$427,000
$459,000
1,225
1,536
1,848
1993
1995
1996
2
Parish Point
$425,000
$500,000
$575,000
1,447
1,552
1,658
1985
1996
2007
2
The Bluff at Wide Awake Plantation
$635,000
$635,000
$635,000
2,091
2,091
2,091
1998
1998
1998
1
Lantana
$399,000
$482,667
$530,000
1,048
1,263
1,389
1956
1956
1956
3
Wyndham
$930,000
$930,000
$930,000
1,813
1,813
1,813
2017
2017
2017
1
Waterway Arms
$599,000
$668,000
$737,000
1,044
1,160
1,276
1971
1972
1973
2
Dorchester Regency
$182,000
$182,000
$182,000
1,152
1,152
1,152
1983
1983
1983
1
Scotts Creek
$1,290,000
$1,895,000
$2,300,000
2,765
4,130
5,284
2012
2013
2014
3
Dogwood Hills
$30,000
$325,833
$547,500
0
2,217
4,338
1984
1985
1986
3
Miley Hill
$147,000
$173,500
$200,000
0
616
1,232
2002
2002
2002
2
Pooshee
$389,000
$774,750
$1,200,000
1,506
2,390
3,490
1955
1991
2024
4
Seaside Oaks
$119,000
$119,000
$119,000
0
0
0
1
Cottage Plantation
$290,000
$365,000
$515,000
0
528
1,585
2022
2022
2022
3
Fort Sumter House
$650,000
$916,667
$1,250,000
577
965
1,193
1920
1957
1975
3
Sidneys Crossroads
$341,000
$341,000
$341,000
0
0
0
1
Sweetgrass Station
$292,895
$380,492
$491,539
1,558
2,111
3,119
2024
2024
2024
32
Palmetto Park
$265,000
$272,500
$275,000
1,013
1,192
1,400
1980
1981
1983
4
Drayton Oaks
$430,000
$531,124
$649,995
1,804
2,692
3,726
2019
2020
2021
4
Magwood
$75,000
$662,500
$1,250,000
0
0
0
2
Parish Place
$355,000
$691,200
$939,899
950
1,615
1,983
1969
1983
2022
4
Chelsea Park
$625,000
$727,000
$785,000
1,688
1,885
2,132
1987
1989
1990
5
Victory Park
$260,000
$260,000
$260,000
704
704
704
1980
1980
1980
1
Santee Circle
$100,000
$487,500
$875,000
0
1,210
2,421
1950
1950
1950
2
Strawberry Community
$95,000
$130,000
$165,000
0
0
0
2
Coosawatchie
$175,000
$175,000
$175,000
1,091
1,091
1,091
1944
1944
1944
1
Pineview
$294,983
$396,992
$499,000
1,150
1,375
1,600
1966
1972
1977
2
Willow Place
$324,990
$324,990
$324,990
1,253
1,253
1,253
1976
1976
1976
1
Huckleberry Hill
$15,000
$302,600
$599,000
0
377
900
1960
1968
1982
5
River Chase
$340,000
$360,000
$375,000
1,800
1,851
1,921
1989
1990
1990
3
Bailey Island Club
$785,000
$785,000
$785,000
0
0
0
1
Dogwood Commons
$499,000
$540,580
$590,000
1,632
1,926
2,050
2012
2018
2022
5
Palmetto Reach
$280,000
$290,500
$299,999
1,436
1,491
1,530
2021
2021
2021
4
Magnolia
$519,500
$621,467
$739,900
980
1,442
1,941
1950
1953
1958
3
Walton Grove
$599,000
$674,450
$749,900
2,285
2,316
2,346
1988
1993
1997
2
Rantowles Groves
$699,900
$699,900
$699,900
3,372
3,372
3,372
1994
1994
1994
1
Dorchester Estates
$259,900
$317,225
$419,000
1,097
1,666
1,968
1903
1967
2024
4
Mulberry Crossing
$515,000
$550,000
$585,000
2,520
2,665
2,810
2017
2018
2018
2
Academy Acres
$498,999
$498,999
$498,999
3,205
3,205
3,205
2004
2004
2004
1
Santee Village
$19,999
$27,500
$35,000
0
0
0
2
Colleton Terrace
$145,000
$145,000
$145,000
888
888
888
1972
1972
1972
1
Gaillard Farms
$259,500
$312,833
$399,000
1,319
1,607
2,001
1997
2015
2024
3
River Point
$495,500
$572,250
$649,000
1,854
2,128
2,403
1969
1985
2001
2
Moss Hills
$249,500
$324,500
$399,500
1,768
1,910
2,053
1975
1979
1983
2
Laurel Park
$529,000
$742,850
$949,000
1,333
2,016
2,495
1954
1979
2024
8
Waterloo Plantation
$400,000
$400,000
$400,000
1,998
1,998
1,998
1950
1950
1950
1
Seagate Village
$332,500
$392,167
$425,000
1,020
1,281
1,472
1987
1997
2004
3
Tar Kiln
$1,450,000
$1,450,000
$1,450,000
2,510
2,510
2,510
2000
2000
2000
1
Moultrie Park
$811,000
$840,500
$870,000
1,857
1,926
1,994
2013
2013
2013
2
Riverview
$1,995,000
$1,995,000
$1,995,000
2,303
2,303
2,303
2019
2019
2019
1
Indigo Island Reserve
$800,000
$837,500
$875,000
3,125
3,299
3,473
2008
2016
2023
2
Edisto Marina
$275,000
$275,000
$275,000
0
0
0
1
Sandy Bluff
$32,000
$49,375
$91,000
0
0
0
8
Howard Heights
$299,999
$299,999
$299,999
1,104
1,104
1,104
1950
1950
1950
1
Essex Village
$350,000
$414,750
$485,000
1,078
1,252
1,442
1960
1960
1961
4
Madison Ridge
$382,000
$382,000
$382,000
2,700
2,700
2,700
2006
2006
2006
1
Hobcaw
$1,250,000
$1,250,000
$1,250,000
2,642
2,642
2,642
2024
2024
2024
1
Jenkins Hill Plantation
$200,000
$200,000
$200,000
0
0
0
1
Old Jermey
$250,000
$435,667
$550,000
0
567
1,700
1940
1940
1940
3
Fieldview
$399,000
$469,300
$539,900
1,956
2,678
3,450
2011
2013
2016
3
Oakhaven
$630,000
$630,000
$630,000
1,607
1,607
1,607
1988
1988
1988
1
Overton
$347,500
$348,250
$349,000
840
1,335
1,830
1970
1977
1983
2
Summerville On The Ashley
$300,000
$324,967
$355,000
1,172
1,325
1,616
1985
1993
1999
3
Johnston Pointe
$615,000
$615,000
$615,000
2,505
2,505
2,505
2018
2018
2018
1
Pon Pon
$225,000
$374,167
$647,500
0
504
1,512
2003
2003
2003
3
Hamlin Oaks
$995,000
$1,122,000
$1,249,000
2,356
2,829
3,302
2018
2019
2019
2
Beaufort Shores
$79,900
$129,900
$179,900
0
0
0
2
Palmetto Pointe
$975,000
$1,050,000
$1,100,000
1,738
1,741
1,742
2007
2007
2007
3
Island House
$785,900
$840,450
$895,000
486
486
486
1973
1973
1973
2
Cypress Point
$598,999
$598,999
$598,999
3,345
3,345
3,345
2021
2021
2021
1
Pinecrest Gardens
$389,000
$463,000
$524,999
1,051
1,344
1,659
1941
1959
1976
3
Beachwood
$3,100,000
$3,100,000
$3,100,000
3,300
3,300
3,300
1984
1984
1984
1
Wando Acres
$335,000
$335,000
$335,000
1,440
1,440
1,440
1965
1965
1965
1
Old Towne Villas
$299,999
$315,000
$325,000
1,415
1,435
1,450
1974
1982
1986
3
Belle Terre
$400,000
$400,000
$400,000
0
0
0
1
Bon Aire
$120,000
$224,950
$329,900
1,274
1,475
1,676
1963
1963
1963
2
Oakcrest
$424,900
$582,471
$699,900
1,338
1,756
2,455
1960
1972
1986
7
Watson
$285,000
$285,000
$285,000
1,064
1,064
1,064
1970
1970
1970
1
Cooper River Townes
$424,990
$482,776
$529,990
1,457
1,564
1,941
2024
2024
2024
10
Plantation
$439,900
$439,900
$439,900
2,930
2,930
2,930
1982
1982
1982
1
The Oaks at St Johns Crossing
$384,900
$502,814
$640,000
1,153
1,873
2,612
2018
2021
2024
7
Majestic Oaks
$696,000
$696,000
$696,000
2,556
2,556
2,556
2000
2000
2000
1
Gahagan
$369,900
$409,950
$440,000
1,792
2,087
2,382
1988
1991
1993
4
Chandlers
$2,700,000
$2,700,000
$2,700,000
0
0
0
1
Givhans
$44,900
$238,267
$625,000
0
667
2,000
2015
2015
2015
3
Park Place
$450,000
$450,000
$450,000
1,533
1,533
1,533
1991
1991
1991
1
Ricefield
$255,000
$262,500
$270,000
1,056
1,056
1,056
1981
1981
1981
2
Bay View Acres
$1,100,000
$1,200,000
$1,300,000
1,443
1,634
1,825
1983
1984
1984
2
Backfield
$309,000
$427,000
$545,000
915
1,835
2,755
1987
1991
1995
2
Albemarle
$469,900
$625,580
$825,000
1,130
1,607
2,168
2004
2004
2004
5
Sea Oats
$2,350,000
$2,350,000
$2,350,000
2,220
2,220
2,220
1986
1986
1986
1
The Paddock at Fairmont South
$389,900
$428,967
$452,000
1,875
2,523
3,194
2019
2020
2021
3
Hampton Park
$1,250,000
$1,250,000
$1,250,000
1,416
1,416
1,416
1925
1925
1925
1
Creekside Acres
$269,000
$329,000
$389,000
1,541
1,762
1,982
1982
1988
1993
2
Elliotborough
$779,000
$1,093,000
$1,550,000
800
1,241
1,612
1880
1963
2005
3
Salisbury Acres
$425,000
$493,333
$590,000
2,151
2,566
3,321
1967
1969
1971
3
Greenview Acres
$90,000
$167,667
$243,000
0
411
1,234
1975
1975
1975
3
The Bend at River Road
$492,000
$609,000
$815,000
1,819
2,016
2,224
2004
2004
2004
3
Yeamans Hall
$325,000
$325,000
$325,000
1,017
1,017
1,017
1960
1960
1960
1
Morningside
$365,000
$365,000
$365,000
1,450
1,450
1,450
1951
1951
1951
1
Village On Central
$260,000
$260,000
$260,000
1,128
1,128
1,128
2004
2004
2004
1
Meadow Lawn
$429,900
$429,900
$429,900
2,310
2,310
2,310
1957
1957
1957
1
Sawmill Trace
$287,000
$287,000
$287,000
1,147
1,147
1,147
1990
1990
1990
1
Joppa Way
$89,000
$184,500
$280,000
0
640
1,280
2005
2005
2005
2
Crescent Cove Villas
$298,990
$311,653
$335,490
1,567
1,573
1,576
2024
2024
2024
14
Wadboo Plantation
$699,999
$699,999
$699,999
2,466
2,466
2,466
2019
2019
2019
1
Simmons Grove
$799,500
$799,500
$799,500
3,485
3,485
3,485
2015
2015
2015
1
Archdale Landing
$305,000
$305,000
$305,000
1,325
1,325
1,325
1988
1988
1988
1
Collins Park Villas
$174,900
$223,700
$260,000
1,344
1,344
1,344
1983
1983
1983
4
Heathwood Ext
$525,000
$649,300
$797,900
1,527
1,832
2,343
1974
1975
1976
3
Garbon Townhomes
$273,990
$300,323
$316,990
1,450
1,550
1,600
2023
2023
2023
3
Stono Watch
$410,000
$524,667
$615,000
1,576
1,628
1,695
1987
1989
1992
3
Lake Moultrie Shores
$357,000
$518,000
$599,000
1,568
1,847
2,200
1970
1984
1995
3
Six Fifty Six Coleman
$799,000
$799,000
$799,000
2,380
2,380
2,380
2008
2008
2008
1
Capri Isle
$699,000
$762,000
$825,000
2,181
2,206
2,232
1964
1965
1966
2
Oakville
$300,000
$300,000
$300,000
1,492
1,492
1,492
1978
1978
1978
1
Waterford Townhomes
$265,000
$302,500
$330,000
2,016
2,096
2,166
2016
2019
2021
4
Lenevar
$575,000
$652,250
$800,000
1,794
2,013
2,344
1964
1968
1973
4
Parkers Ferry
$15,000
$15,000
$15,000
0
0
0
1
Enclave Park
$439,000
$439,000
$439,000
1,530
1,530
1,530
2024
2024
2024
1
Regents Green
$209,000
$225,833
$248,500
845
1,116
1,348
1985
1988
1990
3
Hamlin Park
$550,000
$581,000
$615,000
1,908
2,080
2,540
2005
2005
2006
5
Lazy Acres
$120,000
$309,500
$499,000
0
0
0
2
Blacks
$300,000
$300,000
$300,000
1,624
1,624
1,624
1995
1995
1995
1
Hearthstone
$345,000
$345,000
$345,000
1,560
1,560
1,560
2000
2000
2000
1
Martins Creek
$1,299,000
$1,299,000
$1,299,000
3,173
3,173
3,173
2013
2013
2013
1
Live Oak Subdivision
$175,000
$175,000
$175,000
936
936
936
1964
1964
1964
1
Village Gardens
$340,000
$340,000
$340,000
1,189
1,189
1,189
2006
2006
2006
1
Bordeleaux
$850,000
$850,000
$850,000
1,640
1,640
1,640
1967
1967
1967
1
Warington
$330,000
$349,950
$385,900
1,260
1,414
1,543
1974
1976
1977
4
Peerless Point
$225,000
$225,000
$225,000
0
0
0
1
Vista Park
$230,000
$237,500
$245,000
1,050
1,336
1,622
1969
1969
1969
2
Meadow Run
$270,000
$286,225
$300,000
906
1,097
1,350
1986
1987
1988
4
Caromi Village
$135,000
$193,333
$300,000
880
1,290
2,040
1962
1978
1998
3
Lawton Park
$775,000
$775,000
$775,000
2,560
2,560
2,560
2017
2017
2017
1
Lake Hill
$220,000
$220,000
$220,000
1,908
1,908
1,908
2013
2013
2013
1
Old Georgetown Crossing
$845,000
$845,000
$845,000
1,755
1,755
1,755
1994
1994
1994
1
Liberty Park
$198,000
$198,000
$198,000
1,326
1,326
1,326
1955
1955
1955
1
Hiott Tract
$195,000
$195,000
$195,000
1,120
1,120
1,120
2006
2006
2006
1
Oak Pointe
$379,900
$476,783
$685,618
2,100
2,397
3,045
2023
2024
2024
30
East Oak Forest Ext
$425,000
$425,000
$425,000
1,586
1,586
1,586
1966
1966
1966
1
Sanoree
$120,000
$280,000
$440,000
0
954
1,908
2005
2005
2005
2
Bradford Chase
$294,900
$312,475
$330,000
1,149
1,422
1,680
2005
2006
2006
4
Summit
$815,000
$815,000
$815,000
3,700
3,700
3,700
2007
2007
2007
1
Big Field
$650,000
$875,000
$1,100,000
0
1,050
2,100
2005
2005
2005
2
Red Bank
$185,000
$185,000
$185,000
0
0
0
1
Jasper Acres
$160,000
$160,000
$160,000
965
965
965
2015
2015
2015
1
Club Cottages
$564,900
$564,900
$564,900
988
988
988
2019
2019
2019
1
Feran
$202,000
$567,400
$1,393,000
0
0
0
5
Bright
$20,000
$20,000
$20,000
0
0
0
1
Camp Road Estates
$429,000
$694,500
$960,000
1,501
1,978
2,456
1961
1984
2006
2
Oak Ridge Estates
$135,000
$135,000
$135,000
0
0
0
1
Shemwood II
$975,000
$1,075,000
$1,175,000
1,846
2,046
2,247
1976
1977
1978
2
Cantering Hills
$350,000
$581,667
$845,000
0
1,551
2,650
1979
1981
1983
3
Ocean Pointe Villas
$1,275,000
$1,275,000
$1,275,000
1,400
1,400
1,400
2004
2004
2004
1
Spartina Bay
$250,000
$250,000
$250,000
0
0
0
1
Pine Island Shore
$299,000
$299,000
$299,000
1,760
1,760
1,760
1994
1994
1994
1
Parkside Hpr
$475,000
$485,000
$495,000
1,148
1,171
1,194
2007
2007
2007
2
High Hill
$259,000
$304,500
$350,000
960
1,258
1,555
1982
1986
1989
2
Stony Landing
$530,000
$582,500
$635,000
2,694
3,098
3,503
1994
1999
2003
2
Gold Cup Springs
$425,000
$470,000
$515,000
2,136
2,180
2,224
1962
1970
1977
2
The Cove at Folly
$1,150,000
$1,150,000
$1,150,000
2,226
2,226
2,226
2022
2022
2022
1
Ramsgate Phase II
$42,500
$245,750
$449,000
0
1,352
2,705
2004
2004
2004
2
Crichton Parish
$283,000
$319,300
$340,000
1,378
1,461
1,588
1989
1990
1990
3
St Phillips Place
$339,900
$342,450
$345,000
1,600
1,621
1,642
2000
2001
2001
2
Doelken
$225,000
$225,000
$225,000
0
0
0
1
Medway Landing
$360,000
$399,136
$435,000
1,812
2,500
3,049
2010
2017
2021
11
Deer Ridge Estates
$389,900
$389,900
$389,900
1,647
1,647
1,647
2006
2006
2006
1
Pettigrew
$283,500
$283,500
$283,500
1,150
1,150
1,150
1940
1940
1940
1
Carriage Hill Landing
$550,000
$550,000
$550,000
1,710
1,710
1,710
2013
2013
2013
1
The Bluff at Charleston National
$1,625,000
$1,625,000
$1,625,000
4,039
4,039
4,039
2014
2014
2014
1
Red Bank 2
$369,900
$369,900
$369,900
2,415
2,415
2,415
1994
1994
1994
1
Eagle Harbor
$895,000
$895,000
$895,000
3,980
3,980
3,980
2010
2010
2010
1
Woodlawn
$262,500
$306,250
$350,000
1,049
1,162
1,275
1967
1967
1967
2
Royle Acres
$225,000
$225,000
$225,000
1,311
1,311
1,311
1981
1981
1981
1
Magnolia Village
$999,000
$1,119,000
$1,239,000
3,090
3,110
3,131
2017
2017
2017
2
Battery Point
$589,000
$953,000
$1,645,000
1,257
2,075
2,717
1963
1964
1965
3
Indigo Ridge
$315,000
$330,500
$346,000
1,243
1,464
1,685
1990
1991
1992
2
Crescent View
$1,050,000
$1,050,000
$1,050,000
3,584
3,584
3,584
2014
2014
2014
1
Crystal Shores
$274,900
$294,950
$315,000
1,632
1,740
1,848
1998
2000
2001
2
Seagate Condos
$339,900
$339,900
$339,900
1,472
1,472
1,472
1987
1987
1987
1
Windward Townes
$319,900
$336,702
$346,170
1,485
1,485
1,485
2024
2024
2024
10
Arms Way
$575,000
$724,995
$874,990
825
1,276
1,728
1955
1964
1972
2
Princess Pond
$249,900
$661,225
$1,495,000
1,210
1,822
2,950
1982
1992
2007
4
Oak Forest
$639,000
$719,000
$799,000
1,400
1,596
1,792
1950
1958
1965
2
Preston at Park West
$474,900
$506,200
$549,900
1,752
1,823
1,898
2009
2010
2012
4
River Side
$390,000
$390,000
$390,000
1,540
1,540
1,540
1967
1967
1967
1
Creekside at Beresford
$555,000
$562,500
$570,000
1,823
1,823
1,823
2021
2021
2021
2
General Lee
$515,000
$547,500
$580,000
1,092
1,489
1,886
1962
1964
1966
2
Pamlico Terrace
$619,990
$784,359
$949,990
2,721
3,357
3,768
2024
2024
2024
9
Millbrook
$299,000
$299,000
$299,000
1,295
1,295
1,295
2024
2024
2024
2
Mary Ann Point
$245,000
$247,500
$250,000
0
0
0
2
Marshall Reservation
$2,650,000
$4,816,667
$6,450,000
2,320
4,185
7,000
1942
1976
2008
3
Stone Gate
$899,900
$1,142,450
$1,385,000
2,694
2,910
3,125
2018
2021
2024
2
Teal On The Ashley
$319,900
$319,900
$319,900
1,320
1,320
1,320
2024
2024
2024
1
Ellis Oaks
$2,995,000
$3,556,667
$3,985,000
4,177
4,714
5,343
2004
2013
2019
3
Heritage
$895,000
$1,035,000
$1,175,000
1,612
2,101
2,590
1976
1982
1987
2
Dellwood
$675,000
$677,500
$680,000
1,767
2,096
2,424
1970
1974
1978
2
Harbor Club on Winyah Bay
$359,900
$359,900
$359,900
1,660
1,660
1,660
2021
2021
2021
1
Ridgewood
$319,000
$484,500
$650,000
1,546
2,550
3,553
1964
1982
2000
2
North Point
$1,149,000
$1,481,333
$1,795,000
1,584
2,732
3,787
1994
2002
2015
3
Cassina Plantation
$3,500,000
$3,500,000
$3,500,000
3,751
3,751
3,751
1985
1985
1985
1
Harbor Creek
$675,000
$685,250
$695,500
1,962
2,214
2,466
1986
1986
1986
2
Ventura Villas
$499,000
$499,000
$499,000
1,660
1,660
1,660
1981
1981
1981
1
Huntington Farms
$299,999
$299,999
$299,999
0
0
0
1
Osborn
$725,000
$725,000
$725,000
6,502
6,502
6,502
2004
2004
2004
1
Middlewoods East
$1,695,000
$1,695,000
$1,695,000
2,656
2,656
2,656
1980
1980
1980
1
Oak Ridge Place
$284,900
$284,900
$284,900
1,487
1,487
1,487
2005
2005
2005
1
White Point
$200,000
$200,000
$200,000
3,300
3,300
3,300
1993
1993
1993
1
Hamlins
$325,000
$455,000
$695,000
0
448
1,792
2000
2000
2000
4
Harbor Island Resort
$385,000
$512,000
$639,000
1,069
1,346
1,624
1980
1990
2000
2
R C Builders
$259,900
$259,900
$259,900
1,260
1,260
1,260
1951
1951
1951
1
Mt Royal
$400,000
$400,000
$400,000
1,547
1,547
1,547
2003
2003
2003
1
Treetop Village
$23,000
$161,500
$300,000
0
872
1,743
1994
1994
1994
2
Glen Lake
$725,000
$725,000
$725,000
1,789
1,789
1,789
1998
1998
1998
1
Old Village Landing
$1,500,000
$2,047,500
$2,595,000
2,622
3,466
4,310
1995
2002
2008
2
Murray Hill
$170,000
$334,500
$499,000
794
1,207
1,620
1964
1965
1966
2
West Oak Forest Ext
$575,000
$575,000
$575,000
1,658
1,658
1,658
1961
1961
1961
1
Southern Pines
$435,000
$435,000
$435,000
988
988
988
1950
1950
1950
1
Cravens Grant
$50,000
$50,000
$50,000
0
0
0
4
Harbor Place
$624,900
$637,400
$649,900
1,598
1,670
1,743
1995
1995
1995
2
Deepwater
$599,000
$786,333
$1,135,000
0
677
2,030
1990
1990
1990
3
Boland Park
$230,000
$230,000
$230,000
1,101
1,101
1,101
1960
1960
1960
1
Marsh Pointe
$489,000
$606,580
$849,000
1,225
1,517
2,199
1979
1985
1988
5
Timbercrest Village
$420,000
$420,000
$420,000
1,787
1,787
1,787
2016
2016
2016
1
Plantation Acres
$335,000
$335,000
$335,000
1,500
1,500
1,500
2024
2024
2024
1
Isle De Nemours
$1,500,000
$1,500,000
$1,500,000
0
432
864
1950
1950
1950
2
Wildwood Extention
$289,900
$289,900
$289,900
1,248
1,248
1,248
1982
1982
1982
1
Sandy Run Acres
$220,000
$275,000
$330,000
0
0
0
2
Magnolia Bluff
$495,000
$563,333
$600,000
2,093
2,095
2,099
2017
2018
2019
3
Cedar Plantation
$379,900
$627,450
$875,000
0
1,044
2,089
2019
2019
2019
2
Marsh Winds
$499,000
$499,000
$499,000
1,392
1,392
1,392
2001
2001
2001
1
Fairfax
$300,000
$347,250
$429,000
1,056
1,706
2,168
1981
1984
1987
4
The Meadows
$425,000
$425,000
$425,000
1,004
1,004
1,004
1984
1984
1984
1
Durham Landing
$800,000
$800,000
$800,000
3,574
3,574
3,574
2008
2008
2008
1
Clarks Sound
$430,000
$464,950
$499,900
975
1,248
1,520
1959
1962
1964
2
Belleflower Plantation
$1,000,000
$1,000,000
$1,000,000
3,016
3,016
3,016
2006
2006
2006
1
Bruno Acres
$379,500
$397,250
$415,000
1,090
1,186
1,283
1987
1988
1989
2
Pinecrest
$322,500
$358,750
$395,000
1,220
1,580
1,940
2024
2024
2024
2
Wando Forest
$969,000
$977,250
$985,500
3,326
3,326
3,326
2024
2024
2024
2
Girl Scout Camp
$750,000
$750,000
$750,000
1,605
1,605
1,605
1965
1965
1965
1
Port Park
$214,000
$282,667
$375,000
1,058
1,136
1,269
1951
1975
2024
3
Mathis Ferry Court
$3,195,000
$3,195,000
$3,195,000
5,498
5,498
5,498
2022
2022
2022
1
Lowndes Pointe
$2,395,000
$2,572,500
$2,750,000
2,750
3,618
4,486
2004
2006
2007
2
Charlestown Estates
$559,000
$559,000
$559,000
1,840
1,840
1,840
1963
1963
1963
1
Hut Plantation
$150,000
$150,000
$150,000
0
0
0
1
St. George
$89,000
$89,000
$89,000
1,800
1,800
1,800
1966
1966
1966
1
The Plantation at Stono Ferry
$724,000
$831,500
$939,000
2,164
2,632
3,100
1990
2003
2015
2
Herndon Acres
$299,000
$299,000
$299,000
1,558
1,558
1,558
1963
1963
1963
1
Pemberton at Seaside Plantation
$575,000
$575,000
$575,000
1,800
1,800
1,800
1997
1997
1997
1
Ballards Pointe III
$200,000
$219,500
$239,000
1,328
1,328
1,328
2007
2007
2007
2
Hillcrest
$311,900
$378,759
$443,900
1,257
1,821
2,361
2024
2024
2024
50
Vistiana
$275,000
$295,000
$315,000
1,450
1,450
1,450
2007
2007
2007
2
Lems Bluff
$329,900
$329,900
$329,900
1,944
1,944
1,944
2001
2001
2001
1
Retreat at Beresford
$749,000
$772,000
$795,000
2,064
2,420
2,775
2007
2010
2012
2
Lakewood Estates
$32,000
$32,000
$32,000
0
0
0
1
Autumn Creek
$790,000
$859,500
$929,000
2,474
2,761
3,048
2006
2011
2016
2
Ocean Forest
$3,900,000
$4,050,000
$4,200,000
4,016
5,203
6,390
1998
2002
2006
2
Lakeshore
$885,000
$980,000
$1,075,000
2,500
2,504
2,507
1993
1994
1994
2
Barberry Woods
$515,000
$519,250
$523,500
1,680
1,752
1,824
2004
2005
2005
2
Teal Acres
$374,900
$382,967
$399,000
1,054
1,108
1,216
1956
1959
1960
3
Charleston Oceanfront Villas
$1,395,000
$1,598,333
$1,850,000
1,305
1,580
1,816
1998
1998
1998
3
Kittering Commons
$250,000
$250,000
$250,000
1,388
1,388
1,388
2005
2005
2005
1
Ivey
$270,000
$270,000
$270,000
1,875
1,875
1,875
1973
1973
1973
1
Fulton
$999,000
$1,424,000
$1,849,000
2,246
2,784
3,323
2015
2016
2017
2
Roseville
$749,000
$749,000
$749,000
0
0
0
1
Clarendon
$279,900
$314,700
$349,500
1,658
1,659
1,660
1998
2011
2024
2
Summervale Acres
$275,000
$350,000
$425,000
0
906
1,811
1995
1995
1995
2
Orchard Hill
$225,000
$422,433
$542,300
1,610
1,976
2,182
1985
1988
1992
3
Bur Clare
$189,000
$369,500
$550,000
0
675
1,350
1999
1999
1999
2
Lennox Village
$449,900
$449,900
$449,900
1,037
1,037
1,037
1988
1988
1988
1
Royal Road Area & Pinevista
$99,000
$99,000
$99,000
816
816
816
1961
1961
1961
1
Cottageville Estates
$235,900
$235,900
$235,900
2,052
2,052
2,052
2009
2009
2009
1
Rantowles Shores
$1,100,000
$1,100,000
$1,100,000
1,764
1,764
1,764
1984
1984
1984
1
Lagoon Villas Phase II
$742,000
$768,500
$795,000
1,218
1,218
1,218
1983
1984
1984
2
Belvedere II
$325,000
$325,000
$325,000
1,571
1,571
1,571
1972
1972
1972
1
Cainhoy
$225,000
$285,000
$345,000
0
1,064
2,128
2004
2004
2004
2
Hidden Acres
$52,500
$52,500
$52,500
0
0
0
1
Wando Point
$750,000
$832,500
$915,000
3,000
3,457
3,914
2005
2006
2007
2
Wappoo Shores
$1,095,000
$1,095,000
$1,095,000
3,107
3,107
3,107
1957
1957
1957
1
Wakendaw East
$1,089,000
$1,089,000
$1,089,000
2,835
2,835
2,835
1985
1985
1985
1
Moores Landing
$999,000
$999,000
$999,000
3,217
3,217
3,217
2022
2022
2022
1
Carriage Hill
$635,000
$692,000
$749,000
3,489
3,542
3,596
2014
2015
2015
2
Sweetbriar
$747,000
$747,000
$747,000
3,200
3,200
3,200
1985
1985
1985
1
C Hill
$120,000
$338,318
$556,635
0
958
1,917
2024
2024
2024
2
Blythehaven
$325,000
$355,000
$414,999
1,680
1,789
2,006
2024
2024
2024
3
Cowpens
$1,288,000
$1,288,000
$1,288,000
1,891
1,891
1,891
1991
1991
1991
1
Sewee Preserve
$1,250,000
$1,916,667
$2,750,000
0
1,431
4,292
2016
2016
2016
3
The Retreat at Johns Island
$465,000
$483,167
$499,500
1,436
1,538
1,721
2010
2011
2011
3
Fiddlers Marsh
$1,100,000
$1,100,000
$1,100,000
2,120
2,120
2,120
1994
1994
1994
1
Rivers Point
$360,000
$587,500
$885,000
1,148
1,944
2,737
1978
1989
2003
4
Evergreen Estates
$206,900
$206,900
$206,900
2,592
2,592
2,592
2010
2010
2010
1
Eastside Acres
$39,500
$134,125
$228,750
0
642
1,283
1973
1973
1973
2
The Lakes at Northwoods
$242,500
$242,500
$242,500
1,414
1,414
1,414
1985
1985
1985
1
Chadbury Village
$559,900
$592,300
$625,000
1,256
1,431
1,613
1999
2000
2001
3
Pinckney Farm
$799,990
$799,990
$799,990
1,980
1,980
1,980
2024
2024
2024
1
Brownswood Farms
$449,500
$510,500
$550,000
1,505
1,984
2,291
2012
2012
2013
3
Rivers Reach Pointe
$750,000
$750,000
$750,000
2,745
2,745
2,745
2013
2013
2013
1
Morris Acres
$389,900
$437,225
$499,000
1,188
1,632
1,979
1961
1978
2018
4
Earls Court
$1,195,000
$1,235,000
$1,275,000
1,890
1,890
1,890
2017
2017
2017
2
Sophias Landing
$415,000
$415,000
$415,000
2,428
2,428
2,428
2014
2014
2014
1
Somerset Point
$1,599,900
$1,599,900
$1,599,900
3,920
3,920
3,920
1994
1994
1994
1
Mariners Watch
$549,000
$1,722,000
$2,895,000
607
1,211
1,815
1981
1981
1981
2
Awendaw Landing
$799,000
$1,122,000
$1,445,000
1,436
2,402
3,368
1996
2002
2008
2
Lebby
$648,000
$648,000
$648,000
1,639
1,639
1,639
1989
1989
1989
1
Ropers Run
$764,900
$764,900
$764,900
2,515
2,515
2,515
1995
1995
1995
1
The Village
$1,885,000
$1,885,000
$1,885,000
3,193
3,193
3,193
2010
2010
2010
1
Victoria Place
$229,000
$247,000
$265,000
938
1,022
1,107
1980
1982
1984
2
Harbor View
$525,000
$525,000
$525,000
1,000
1,000
1,000
1965
1965
1965
1
Runnymeade Farm
$415,000
$415,000
$415,000
1,453
1,453
1,453
2005
2005
2005
1
Grantville
$843,000
$843,000
$843,000
1,858
1,858
1,858
1950
1950
1950
1
Meese Acres
$180,000
$180,000
$180,000
1,782
1,782
1,782
1998
1998
1998
1
Cross
$299,900
$299,900
$299,900
1,536
1,536
1,536
1972
1972
1972
1
Roxbury
$1,799,900
$1,799,900
$1,799,900
4,334
4,334
4,334
1988
1988
1988
1
Chaplins
$375,000
$375,000
$375,000
0
0
0
1
Marshview Villas
$439,000
$457,000
$475,000
1,064
1,182
1,300
1988
1988
1988
2
Gadsden Hall
$9,000
$9,000
$9,000
0
0
0
1
Contentment Hall
$345,000
$981,667
$1,950,000
0
1,012
3,035
2001
2001
2001
3
Shemwood
$1,350,000
$1,574,500
$1,799,000
2,106
2,692
3,277
1957
1960
1963
2
The Village at Seabrook
$348,000
$977,667
$1,385,000
0
1,418
2,198
2005
2015
2024
3
Dominion Village
$529,000
$529,500
$530,000
2,047
2,047
2,047
2014
2014
2014
2
Grove Creek Village
$649,000
$649,000
$649,000
1,476
1,476
1,476
1965
1965
1965
1
Cypress Hill
$285,000
$285,000
$285,000
0
0
0
1
Morgan Place
$3,395,000
$3,395,000
$3,395,000
4,019
4,019
4,019
2000
2000
2000
1
Jamison Terrace
$299,999
$299,999
$299,999
1,212
1,212
1,212
1976
1976
1976
1
Hyrne Hall
$13,000
$13,000
$13,000
0
0
0
1
Glenlake
$675,000
$700,000
$725,000
1,726
1,793
1,846
1994
1994
1995
3
Fairway Place
$749,000
$762,000
$775,000
2,070
2,112
2,155
1988
1989
1989
2
Bogoslow
$195,000
$237,967
$269,000
1,329
2,118
2,728
1955
1964
1976
3
The Legends at Mt Pleasant
$280,000
$280,000
$280,000
753
753
753
2000
2000
2000
1
Village Oaks of Mt Pleasant
$385,000
$385,000
$385,000
960
960
960
1979
1979
1979
1
Vanderhorst
$3,490,000
$4,983,500
$7,850,000
4,000
5,160
6,352
1988
2002
2024
4
The Neck
$379,000
$1,324,667
$2,495,000
0
1,310
2,606
1998
1999
1999
3
Berkeley Commons Townhomes
$275,000
$275,000
$275,000
1,577
1,577
1,577
2006
2006
2006
1
Royal Oaks at Liberty Hill
$800,000
$800,000
$800,000
3,109
3,109
3,109
2022
2022
2022
1
Yough Hall
$775,000
$962,500
$1,150,000
0
1,332
2,664
2006
2006
2006
2
Sanders
$279,000
$414,450
$549,900
2,000
2,121
2,242
1975
2000
2024
2
Plantation Hills
$105,000
$327,500
$550,000
0
2,250
4,500
2006
2006
2006
2
Hillside Farms
$487,900
$518,950
$550,000
2,205
2,310
2,414
2006
2010
2013
2
Bailey Island
$1,995,000
$1,995,000
$1,995,000
3,023
3,023
3,023
2014
2014
2014
1
Reverie On The Ashley
$672,500
$704,167
$765,000
1,754
1,754
1,754
2007
2007
2008
3
Kogerville
$325,000
$325,000
$325,000
821
821
821
1960
1960
1960
1
St Charles Place
$350,000
$350,000
$350,000
1,780
1,780
1,780
2010
2010
2010
1
Cross Creek
$795,000
$795,000
$795,000
2,530
2,530
2,530
1997
1997
1997
1
Fairway Villas
$471,000
$471,000
$471,000
1,293
1,293
1,293
2005
2005
2005
1
Greenfield Estates
$350,000
$360,000
$370,000
1,840
1,863
1,886
1976
1984
1991
2
Pearson
$360,000
$360,000
$360,000
2,850
2,850
2,850
1973
1973
1973
1
Queens Row
$800,000
$800,000
$800,000
1,849
1,849
1,849
1997
1997
1997
1
Gadsden Village
$449,900
$449,900
$449,900
1,125
1,125
1,125
1962
1962
1962
1
Amberwood
$330,000
$330,000
$330,000
1,568
1,568
1,568
1987
1987
1987
1
Etiwan Park
$1,200,000
$1,200,000
$1,200,000
2,370
2,370
2,370
2001
2001
2001
1
Bates Estates
$525,000
$525,000
$525,000
1,568
1,568
1,568
2007
2007
2007
1
Northbridge Village
$675,000
$675,000
$675,000
2,195
2,195
2,195
1977
1977
1977
1
Yacht Harbor Villas
$799,000
$837,000
$875,000
1,357
1,468
1,578
1986
1986
1986
2
Bradford Village
$160,000
$170,000
$180,000
1,062
1,231
1,400
1984
1986
1987
2
Loblolly Bay Forest
$275,000
$275,000
$275,000
0
0
0
1
The Gates
$400,000
$400,000
$400,000
1,397
1,397
1,397
2002
2002
2002
1
The Cedars
$194,900
$194,900
$194,900
1,104
1,104
1,104
1999
1999
1999
1
Ballards Pointe II
$225,000
$259,760
$299,900
1,298
1,454
1,689
2005
2005
2006
5
Beckett Plantation
$198,000
$345,667
$574,000
0
0
0
3
Crafts House
$820,000
$1,128,750
$1,990,000
956
1,404
2,706
1881
1936
1986
4
Cedar Point
$1,150,000
$1,150,000
$1,150,000
2,734
2,734
2,734
2008
2008
2008
1
Shulerville
$285,000
$285,000
$285,000
1,824
1,824
1,824
2007
2007
2007
1
200 River Landing Dr
$595,000
$738,000
$949,999
1,548
1,618
1,748
2006
2006
2007
3
Burbage Acres
$449,900
$449,900
$449,900
1,666
1,666
1,666
2000
2000
2000
1
Blackwell Terrace
$195,000
$195,000
$195,000
798
798
798
1950
1950
1950
1
Noisette Towns
$619,900
$643,633
$676,000
2,127
2,300
2,406
2021
2022
2022
3
Farmington
$499,000
$518,125
$537,250
1,223
1,258
1,292
1996
1999
2002
2
Challedon
$70,000
$167,500
$265,000
0
525
1,050
1969
1969
1969
2
Medway Plantation
$365,000
$365,000
$365,000
1,711
1,711
1,711
2018
2018
2018
1
Belmont
$168,000
$223,594
$290,000
1,000
1,084
1,308
1964
1981
1991
4
Country Club Estates
$547,500
$572,500
$597,500
2,645
2,806
2,968
1960
1963
1965
2
Edgewater Park
$750,000
$874,000
$998,000
1,911
1,961
2,011
1952
1954
1956
2
Arbor Oaks
$367,000
$367,000
$367,000
2,174
2,174
2,174
2004
2004
2004
1
River Landing
$1,200,000
$1,200,000
$1,200,000
2,605
2,699
2,793
1996
1998
2000
2
Cherry Hill Plantation
$150,000
$150,000
$150,000
0
0
0
2
Goat Island
$875,000
$991,667
$1,225,000
1,200
2,208
3,464
2003
2005
2007
3
Hickory Farms
$1,200,000
$1,200,000
$1,200,000
3,778
3,778
3,778
1996
1996
1996
1
Cedar Hall
$3,000,000
$3,000,000
$3,000,000
0
0
0
1
Waterfront Plantation
$1,525,000
$1,587,500
$1,650,000
2,300
2,345
2,390
1987
1987
1987
2
Pawleys Pavillion
$290,000
$290,000
$290,000
1,250
1,250
1,250
2005
2005
2005
1
Southern Magnolia
$399,800
$399,800
$399,800
2,643
2,643
2,643
2003
2003
2003
1
Palmetto Plantation
$350,000
$350,000
$350,000
1,480
1,480
1,480
1991
1991
1991
1
Garden Sands
$249,000
$249,000
$249,000
584
584
584
1985
1985
1985
1
Warrick Oaks
$904,000
$904,000
$904,000
1,774
1,774
1,774
2017
2017
2017
1
Parkview
$372,500
$373,750
$375,000
1,747
1,747
1,747
1989
1996
2002
2
Shady Acres
$350,000
$395,000
$440,000
1,496
1,498
1,500
1999
2001
2002
2
East Oak Forest
$489,000
$549,500
$610,000
1,566
2,178
2,790
1960
1963
1966
2
Wappoo Landing
$880,000
$887,500
$895,000
1,866
1,901
1,936
2003
2003
2003
2
Foxbourgh
$315,000
$315,000
$315,000
1,390
1,390
1,390
1986
1986
1986
1
Pt Goshen-Dungannon
$449,900
$449,900
$449,900
1,195
1,195
1,195
1952
1952
1952
1
White Point Estates
$1,460,000
$1,460,000
$1,460,000
4,210
4,210
4,210
1971
1971
1971
1
The Preserve at Dills Bluff
$900,000
$900,000
$900,000
2,828
2,828
2,828
2017
2017
2017
1
Highland Acres
$265,000
$272,250
$279,500
1,165
1,702
2,240
1980
1994
2007
2
Wando Gardens
$479,900
$482,450
$485,000
1,308
1,410
1,512
1966
1966
1966
2
Mullett Hall
$775,000
$775,000
$775,000
0
0
0
1
Tyner Trail
$318,000
$318,000
$318,000
1,789
1,789
1,789
2007
2007
2007
1
Potato Creek Bay
$320,000
$320,000
$320,000
1,164
1,164
1,164
1992
1992
1992
1
Harleston Green
$985,000
$985,000
$985,000
1,783
1,783
1,783
1989
1989
1989
1
Deerfield Hall
$599,000
$599,000
$599,000
3,379
3,379
3,379
2016
2016
2016
1
Hunters Creek
$155,000
$155,000
$155,000
1,612
1,612
1,612
1988
1988
1988
1
Owens
$357,900
$357,900
$357,900
1,500
1,500
1,500
1985
1985
1985
1
Wakendaw
$950,000
$950,000
$950,000
1,902
1,902
1,902
1987
1987
1987
1
Back River Bend
$312,900
$358,757
$386,900
1,045
1,543
1,773
2024
2024
2024
21
Otranto Club Villas
$185,000
$185,000
$185,000
1,209
1,209
1,209
1978
1978
1978
1
Cherokee Place
$299,000
$299,000
$299,000
0
0
0
1
Egrets Pointe
$724,900
$724,900
$724,900
1,650
1,650
1,650
1994
1994
1994
1
Sprucewood
$275,000
$278,267
$279,900
0
814
1,319
1971
1976
1980
3
Beauregard House
$565,000
$565,000
$565,000
1,037
1,037
1,037
1840
1840
1840
1
Mclaura Bluff
$539,999
$539,999
$539,999
2,019
2,019
2,019
2006
2006
2006
1
Grassy Creek
$1,275,000
$1,455,000
$1,600,000
2,604
2,909
3,093
2005
2011
2016
3
Samanthas Estate
$253,990
$253,990
$253,990
1,387
1,387
1,387
2024
2024
2024
1
Alston Place
$243,999
$246,999
$249,999
1,295
1,295
1,295
2019
2019
2019
2
Saltgrass Pointe
$1,595,000
$1,595,000
$1,595,000
2,666
2,666
2,666
2001
2001
2001
1
Marsh Aire
$699,000
$699,000
$699,000
1,414
1,414
1,414
2004
2004
2004
1
Stonefield
$485,999
$571,666
$650,000
1,112
1,493
2,057
1984
1988
1995
3
Hidden Lakes
$875,000
$1,087,000
$1,299,000
2,409
2,554
2,700
1988
1993
1998
2
Hickory Oaks
$269,000
$304,500
$340,000
1,421
1,988
2,556
2006
2007
2007
2
Peurifoy Terrace
$219,000
$219,000
$219,000
1,902
1,902
1,902
1950
1950
1950
1
Cainhoy Village
$359,000
$359,000
$359,000
0
0
0
1
Brown Hickory Hill
$375,000
$401,500
$428,000
0
0
0
2
Caw Caw Farms
$625,000
$625,000
$625,000
1,472
1,472
1,472
1993
1993
1993
1
The Village at Carol Oaks
$445,000
$445,000
$445,000
1,421
1,421
1,421
2015
2015
2015
1
The Villas of West Ashley
$400,000
$442,500
$485,000
1,377
1,550
1,724
2003
2003
2003
2
Riverbend
$335,000
$340,000
$345,000
1,251
1,699
2,147
1959
1962
1964
2
The Palms Hotel
$445,000
$472,000
$499,000
414
417
420
2000
2000
2000
2
Evanston Estates
$399,000
$409,450
$419,900
1,496
1,608
1,721
1966
1967
1967
2
Shahid Row
$195,000
$195,000
$195,000
1,080
1,080
1,080
1984
1984
1984
1
Printers Row
$1,050,000
$1,122,500
$1,195,000
1,556
1,621
1,686
1890
1900
1909
2
The Reserve at Old Point
$199,000
$212,000
$225,000
650
732
815
1974
1977
1979
2
Mill Creek
$255,000
$352,500
$450,000
1,568
2,052
2,537
1960
1978
1996
2
Hagley Estates
$350,000
$812,500
$1,275,000
0
2,276
4,553
2009
2009
2009
2
Ft Lamar
$799,900
$799,900
$799,900
2,142
2,142
2,142
2024
2024
2024
1
Buck Run at Deer Park
$325,000
$325,000
$325,000
1,706
1,706
1,706
2006
2006
2006
1
Gippy Plantation
$589,000
$589,000
$589,000
0
0
0
1
Chapel Branch
$249,990
$249,990
$249,990
1,634
1,634
1,634
2024
2024
2024
2
Buckfield Farms
$255,000
$255,000
$255,000
1,848
1,848
1,848
1993
1993
1993
1
Swamp Fox Acres
$159,000
$159,000
$159,000
1,904
1,904
1,904
1998
1998
1998
1
Sylcope
$375,000
$375,000
$375,000
1,445
1,445
1,445
1965
1965
1965
1
Bayfront
$1,300,000
$1,895,000
$2,490,000
2,430
3,046
3,661
2005
2015
2024
2
Parkwood Heights
$795,000
$795,000
$795,000
2,677
2,677
2,677
1965
1965
1965
1
David Gatch
$79,900
$253,267
$379,900
0
709
1,064
1992
1992
1992
3
Marshall Acres
$350,000
$350,000
$350,000
1,286
1,286
1,286
2024
2024
2024
1
Cresent Estates
$175,900
$175,900
$175,900
1,056
1,056
1,056
1999
1999
1999
1
Abbapoola Creek
$1,775,000
$1,775,000
$1,775,000
3,187
3,187
3,187
1988
1988
1988
1
Woodlawn Terrace
$260,000
$260,000
$260,000
1,818
1,818
1,818
1980
1980
1980
1
Walnut Hill
$3,800,000
$3,800,000
$3,800,000
0
0
0
1
Village at Seabrook
$349,900
$349,900
$349,900
0
0
0
1
Wakendaw Place
$674,900
$674,900
$674,900
1,834
1,834
1,834
1994
1994
1994
1
Storm Haven
$370,000
$370,000
$370,000
2,240
2,240
2,240
2002
2002
2002
1
Secessionville Acres
$750,000
$750,000
$750,000
1,597
1,597
1,597
1962
1962
1962
1
Sunshine Acres
$299,000
$299,000
$299,000
2,248
2,248
2,248
2001
2001
2001
1
Howe Hall
$400,000
$400,000
$400,000
0
0
0
1
Wexford Park
$725,000
$750,000
$775,000
1,728
1,828
1,928
2013
2014
2014
2
Lake Moultrie Recreation
$290,000
$290,000
$290,000
1,624
1,624
1,624
2003
2003
2003
1
Old Orchard
$499,000
$499,000
$499,000
1,500
1,500
1,500
1966
1966
1966
1
Charlestowne Estates III
$625,000
$625,000
$625,000
2,300
2,300
2,300
1964
1964
1964
1
The Enclave
$1,690,000
$1,690,000
$1,690,000
3,376
3,376
3,376
2024
2024
2024
1
Pinopolis Peninsula
$575,000
$575,000
$575,000
2,466
2,466
2,466
1965
1965
1965
1
Browning Estates
$175,000
$430,000
$685,000
0
1,020
2,040
1976
1976
1976
2
Blackstone
$309,900
$329,950
$350,000
1,138
1,138
1,138
2010
2010
2010
2
Southwind
$275,000
$275,000
$275,000
1,000
1,000
1,000
1983
1983
1983
1
Humbert
$99,999
$99,999
$99,999
0
0
0
1
Highland Hills
$224,000
$224,000
$224,000
2,072
2,072
2,072
1999
1999
1999
1
Westland
$500,000
$500,000
$500,000
1,355
1,355
1,355
2012
2012
2012
1
Oakhart Plantation
$890,000
$890,000
$890,000
1,768
1,768
1,768
2002
2002
2002
1
Quail Run
$645,000
$645,000
$645,000
2,100
2,100
2,100
1975
1975
1975
1
Part Goshen Plantation
$1,150,000
$1,150,000
$1,150,000
2,335
2,335
2,335
1991
1991
1991
1
Bonneau Park
$85,000
$192,000
$299,000
0
720
1,440
1992
1992
1992
2
The Willows
$364,500
$364,500
$364,500
1,104
1,104
1,104
1985
1985
1985
1
Ballam Oaks
$816,451
$889,635
$1,010,431
2,265
3,071
3,930
2024
2024
2024
5
The Commons at Grand Oaks
$449,900
$449,900
$449,900
1,764
1,764
1,764
2013
2013
2013
1
Log Bridge
$500,000
$500,000
$500,000
0
0
0
1
West Oaks
$265,000
$275,000
$285,000
1,259
1,310
1,360
1978
1978
1978
2
Palmetto Village
$389,000
$389,000
$389,000
1,466
1,466
1,466
2018
2018
2018
1
Riley
$409,900
$423,700
$437,500
1,540
2,150
2,760
1983
1983
1983
2
Hanahan Plantation
$414,900
$414,900
$414,900
1,823
1,823
1,823
2002
2002
2002
1
Riverland Park
$650,000
$650,000
$650,000
2,566
2,566
2,566
2014
2014
2014
1
Oak Ridge II
$219,000
$219,000
$219,000
1,014
1,014
1,014
1983
1983
1983
1
Riverland Place
$299,000
$299,000
$299,000
1,020
1,020
1,020
1987
1987
1987
1
Founders Corner
$408,935
$449,171
$512,265
1,749
2,384
3,129
2024
2024
2024
5
Planters Walk
$235,000
$235,000
$235,000
1,030
1,030
1,030
1983
1983
1983
1
Hunters Run
$409,000
$409,000
$409,000
1,066
1,066
1,066
1987
1987
1987
1
Hibben Ferry
$375,000
$375,000
$375,000
1,030
1,030
1,030
1983
1983
1983
1
Singing Pines
$315,000
$315,000
$315,000
1,615
1,615
1,615
1960
1960
1960
1
Pleasant Grove
$100,000
$100,000
$100,000
728
728
728
1991
1991
1991
1
Edenvale Farms
$499,000
$499,000
$499,000
0
0
0
1
Park Island
$5,200,000
$5,200,000
$5,200,000
5,672
5,672
5,672
2022
2022
2022
1
Cardinal Heights
$278,000
$278,000
$278,000
1,000
1,000
1,000
1960
1960
1960
1
Lockwood Hall
$467,900
$467,900
$467,900
1,420
1,420
1,420
1966
1966
1966
1
Wakendaw Manor
$1,750,000
$1,750,000
$1,750,000
3,241
3,241
3,241
1984
1984
1984
1
Sweetgrass Village
$794,500
$794,500
$794,500
2,038
2,038
2,038
2013
2013
2013
1
Gardners View
$775,000
$775,000
$775,000
4,046
4,046
4,046
2015
2015
2015
1
Bates Estates II
$320,000
$320,000
$320,000
1,600
1,600
1,600
2022
2022
2022
1
Cross Creek Estates
$389,900
$392,450
$395,000
1,595
1,816
2,037
2000
2001
2001
2
Kingsland
$389,900
$389,900
$389,900
1,040
1,040
1,040
1963
1963
1963
1
Grande Dunes
$1,790,000
$1,790,000
$1,790,000
3,866
3,866
3,866
2005
2005
2005
1
Dupont
$399,500
$399,500
$399,500
1,512
1,512
1,512
2000
2000
2000
1
Lynwood Villas
$337,000
$337,000
$337,000
1,222
1,222
1,222
1985
1985
1985
1
Shiver Farms
$130,000
$130,000
$130,000
0
0
0
1
Whitesville
$140,000
$140,000
$140,000
0
0
0
1
Vineyard Rue
$1,500,000
$1,500,000
$1,500,000
1,248
1,248
1,248
1981
1981
1981
1
Inland Court
$239,900
$239,900
$239,900
660
660
660
1960
1960
1960
1
Woodview
$239,000
$239,000
$239,000
1,435
1,435
1,435
1977
1977
1977
1
Walden Ridge
$299,999
$299,999
$299,999
1,477
1,477
1,477
2004
2004
2004
1
Coral Acres
$309,000
$309,000
$309,000
1,568
1,568
1,568
2022
2022
2022
1
Toogoodoo
$135,000
$135,000
$135,000
0
0
0
1
Pt Hickory Hill
$895,000
$895,000
$895,000
3,111
3,111
3,111
2012
2012
2012
1
Bull Point Plantation
$24,500
$24,500
$24,500
0
0
0
1
Waterfront Point
$1,375,000
$1,375,000
$1,375,000
2,264
2,264
2,264
2001
2001
2001
1
Ireland Ridge
$179,000
$179,000
$179,000
1,216
1,216
1,216
2024
2024
2024
1
Matthews
$2,930,000
$2,930,000
$2,930,000
5,299
5,299
5,299
1989
1989
1989
1
Garden Hill
$300,000
$300,000
$300,000
679
679
679
1948
1948
1948
1
Havenwood
$402,000
$402,000
$402,000
2,368
2,368
2,368
1982
1982
1982
1
Turtle Bay
$850,000
$882,500
$915,000
1,532
1,550
1,568
2001
2002
2003
2
Fiddlers Cove
$1,193,745
$1,378,488
$1,506,155
3,000
3,490
3,906
2024
2024
2024
5
Bayfield
$365,000
$365,000
$365,000
1,064
1,064
1,064
1985
1985
1985
1
Berkley Hills
$414,999
$414,999
$414,999
1,440
1,440
1,440
1956
1956
1956
1
Land O Pines
$375,000
$375,000
$375,000
2,068
2,068
2,068
1977
1977
1977
1
Beach Club Villas
$2,150,000
$2,150,000
$2,150,000
1,644
1,644
1,644
1980
1980
1980
1
Dove Run
$299,000
$299,000
$299,000
1,038
1,038
1,038
1984
1984
1984
1
Perry Hill
$260,000
$260,000
$260,000
0
0
0
1
Rialde Farms
$1,700,000
$1,700,000
$1,700,000
4,000
4,000
4,000
2003
2003
2003
1
Woodside
$260,000
$260,000
$260,000
1,296
1,296
1,296
1971
1971
1971
1
River Run
$1,299,000
$1,299,000
$1,299,000
2,810
2,810
2,810
2021
2021
2021
1
Cordesville
$700,000
$700,000
$700,000
2,717
2,717
2,717
2008
2008
2008
1
Wrights Point
$3,250,000
$3,250,000
$3,250,000
4,328
4,328
4,328
2004
2004
2004
1
Selkirk Plantation
$4,500,000
$4,500,000
$4,500,000
3,500
3,500
3,500
2020
2020
2020
1
Sheppards Park
$665,000
$945,000
$1,225,000
2,471
2,558
2,646
1969
1981
1992
2
Bryans
$875,000
$875,000
$875,000
1,987
1,987
1,987
1983
1983
1983
1
Long Branch On The Creek
$650,000
$650,000
$650,000
2,746
2,746
2,746
1977
1977
1977
1
Jax Road
$1,100,000
$1,100,000
$1,100,000
2,248
2,248
2,248
2004
2004
2004
1
The Enclave at Gregorie Ferry
$719,000
$719,000
$719,000
2,670
2,670
2,670
2014
2014
2014
1
White Oak II
$599,000
$599,000
$599,000
1,600
1,600
1,600
1970
1970
1970
1
Holly Place
$325,000
$325,000
$325,000
2,018
2,018
2,018
2007
2007
2007
1
The Pointe
$2,150,000
$2,150,000
$2,150,000
3,536
3,536
3,536
2014
2014
2014
1
Shelmore Village
$964,000
$964,000
$964,000
1,842
1,842
1,842
2007
2007
2007
1
Fair Oaks
$130,000
$130,000
$130,000
0
0
0
1
Home Park
$175,000
$175,000
$175,000
612
612
612
1947
1947
1947
1
Tennis Club
$799,000
$799,000
$799,000
942
942
942
1982
1982
1982
1
Brookdale at Forest Hills
$310,000
$310,000
$310,000
1,279
1,279
1,279
2013
2013
2013
1
Beckett
$149,900
$149,900
$149,900
0
0
0
1
Grand Terrace
$469,900
$469,900
$469,900
2,456
2,456
2,456
2020
2020
2020
1
Fishing Creek Resort
$170,000
$170,000
$170,000
0
0
0
1
Old Village at Ravenel
$850,000
$850,000
$850,000
2,783
2,783
2,783
2017
2017
2017
1
Stono Terrace
$850,000
$850,000
$850,000
3,048
3,048
3,048
1940
1940
1940
1
Dubois
$450,000
$450,000
$450,000
2,314
2,314
2,314
1973
1973
1973
1
Parkshore III
$880,000
$880,000
$880,000
2,538
2,538
2,538
1979
1979
1979
1
Scotts Lake
$55,000
$55,000
$55,000
924
924
924
1974
1974
1974
1
Laurel Lakes
$725,000
$725,000
$725,000
1,940
1,940
1,940
2003
2003
2003
1
Pembroke
$425,000
$425,000
$425,000
2,620
2,620
2,620
1997
1997
1997
1
Captain Quarters
$1,349,999
$1,349,999
$1,349,999
2,009
2,009
2,009
2024
2024
2024
1
Colony North II
$400,000
$400,000
$400,000
2,170
2,170
2,170
2010
2010
2010
1
Romney Village
$325,000
$325,000
$325,000
1,188
1,188
1,188
1971
1971
1971
1
Highlands of Legend Oaks
$330,000
$330,000
$330,000
1,600
1,600
1,600
2017
2017
2017
1
Ashley Hall Plantation
$675,000
$675,000
$675,000
2,333
2,333
2,333
1980
1980
1980
1
Parkland Preserve
$620,000
$620,000
$620,000
1,790
1,790
1,790
2009
2009
2009
1
Bulls Bay Overlook
$850,000
$850,000
$850,000
0
0
0
1
Pine Knoll
$249,000
$249,000
$249,000
1,530
1,530
1,530
2004
2004
2004
1
Hickory Valley
$485,000
$485,000
$485,000
3,857
3,857
3,857
1910
1910
1910
1
Minnie D Berry
$229,000
$229,000
$229,000
1,052
1,052
1,052
1972
1972
1972
1
Ravens Bluff
$2,600,000
$2,600,000
$2,600,000
3,800
3,800
3,800
2024
2024
2024
1
Civic Center
$325,000
$325,000
$325,000
2,440
2,440
2,440
1940
1940
1940
1
Clydeville
$169,000
$169,000
$169,000
0
0
0
1
Hawthorne Height
$195,000
$195,000
$195,000
2,079
2,079
2,079
1962
1962
1962
1
Sans Souci
$399,900
$399,900
$399,900
980
980
980
1965
1965
1965
1
Jo Eva Cove
$450,000
$450,000
$450,000
1,687
1,687
1,687
2005
2005
2005
1
Brown Wood Road
$300,000
$300,000
$300,000
1,550
1,550
1,550
1988
1988
1988
1
Orange Hill Plantation
$6,399,000
$6,399,000
$6,399,000
9,943
9,943
9,943
2010
2010
2010
1
West Park
$315,000
$315,000
$315,000
960
960
960
1971
1971
1971
1
Harbor Place Villas
$450,000
$450,000
$450,000
1,380
1,380
1,380
1994
1994
1994
1
Charlestowne Estates II
$625,000
$625,000
$625,000
1,690
1,690
1,690
1962
1962
1962
1
Red Oak
$230,000
$230,000
$230,000
1,122
1,122
1,122
1985
1985
1985
1
The Cove at Martins Creek
$789,000
$817,000
$845,000
2,442
2,706
2,970
2019
2020
2020
2
Cameron Terrace Manor
$779,900
$779,900
$779,900
2,496
2,496
2,496
2014
2014
2014
1
Wellesley Place
$594,000
$594,000
$594,000
1,400
1,400
1,400
2003
2003
2003
1
Waterloo Estates
$895,000
$895,000
$895,000
2,773
2,773
2,773
2019
2019
2019
1
Sandhurst West
$969,000
$969,000
$969,000
2,354
2,354
2,354
1976
1976
1976
1
Colleton Acres
$245,000
$245,000
$245,000
1,091
1,091
1,091
1983
1983
1983
1
Pinckneys Mill
$216,000
$216,000
$216,000
0
0
0
1
Wilmor Acres
$259,000
$259,000
$259,000
2,016
2,016
2,016
2004
2004
2004
1
Mt PleasantJames IslandDaniel IslandWest AshleyDowntownFolly BeachIsle of PalmsSullivans IslandKiawah IslandJohn's Island
Average Price Per Sq Ft Sold Homes Charleston SC
Mt PleasantJames IslandDaniel IslandWest AshleyDowntownFolly BeachIsle of PalmsSullivans IslandKiawah IslandJohn's Island
Housing vacancies are currently at the lowest levels since at least 2005, according to the Census Bureau estimates. Nationally, the rental vacancy rate was 7.3 percent while homeowner housing rate was 1.9 percent for the third quarter 2015.
CHARLESTON SC INVESTMENT PROPERTIES & INCOME PRODUCING REAL ESTATE
For investors in Charleston SC the real estate game is a tricky one. We all made thousands and — probably millions if you add it all up — flipping houses, leasing offices and renovating condos. Then the real estate market collapsed, throwing the U.S. into the 2007-2009 recession.
Now the prognosis for real estate investments is looking much better, though it’s anything but simple. Some commercial real estate has rebounded, with investors craving income that real estate provides, while Low-country residential Charleston real estate — particularly single-family homes — may be at once-in-a-lifetime bargain prices.
Four top experts were asked for their take on the the opportunities and potential pitfalls facing real estate investors in the coming years. Edited excerpts of their interviews follow:
Jim Sullivan, managing director of REIT research, Green Street Advisors
Every diversified investor should have some exposure to commercial real estate, and REITs [real estate investment trusts] provide a terrific, transparent and liquid way to get that exposure. Operating fundamentals in most property types range from good to great, with good being the shopping center business and industrial business and great being the apartment business. The economy is not doing great, but the silver lining for commercial real estate is how little new supply is coming on the market. Too much new commercial construction is typically what puts a halt to real estate recoveries. This time around, it’s just not an issue.
REITs tend to be specialized by property type. You can pick and choose, depending on what your economic outlook might be. If your forecast is a little rosier, you’d want to be in property types that respond well in economic recoveries — hotels, for example, or REITs that own shopping centers with lots of small tenants. If you wanted to be a bit more defensive, health care REITs are a terrific place to be. When investing in Charleston real estate the safe bet would obviously be in tourism based avenues considering that is the most consistent driver of revenue.
The biggest opportunity is buying distressed single-family homes, because that market has been completely beat up. The next biggest opportunity is buying land because very few people have been focused on it. If you have a long-term view, you’ll probably see a significant multiple return. Buying land is a complicated business, though. Mom-and-pop investors should not be buying land.
Lauren Pressman, director of investment research at wealth management firm Aspiriant
The U.S. is in a period of sustained but very slow growth. Job reports are huge factors for real estate, because jobs create demand for housing, for offices, for travel and at retail establishments. We’re wary of things like retail and office, except in very unique circumstances. Multifamily real estate (apartment buildings) arguably had all the tail winds at its back to do the best of all asset classes. However, be careful. There is so much capital chasing multifamily, and that can lift prices beyond a point where your return is commensurate with risk.
No matter what your strategy is always be careful and have a good local agent to help you navigate through the maze of options out there for investing in real estate in Charleston or anywhere. Find a great contractor in Charleston and let them help you with the renovations, and repair necessary to get a C.O. and move onto the next real estate opportunity.
VACATION RENTALS
One of the long tried and true income producing real estate investments popular in Charleston area is in beachfront homes or resort vacation rentals. It’s no mystery that homes in beach communities are very attractive year round and hundreds of thousands of visitors come to our beaches in S.C. to unwind. Homes for sale on the Isle of Palms and in Wild Dunes real estate make big money on weekly vacation rentals for their owners. Many developers and investors will even buy an existing home, tear it down and build a new one just for the returns it can produce. Weekly rentals on Folly Beach, Kiawah, Seabrook Island, and even downtown Charleston garner upwards of $4000 to $7000+. Even with HOA Dues in Wild Dunes, Kiawah Island, and Seabrook Island + monthly regimes for condos/villas these properties can get easily $30,000 yr for one bedroom to $90k+ for beachfront and 3 bedroom units.
There has never been a better time to pull money out of the equities market and into real estate, rates are low, and prices are too.
The factors that determine the cost of your home’s insurance expenses varies greatly as one can imagine. However, here in Charleston SC there are additional concerns that we have to consider like; wind from hurricane’s, flooding from, and the intense heat our summers bring. All these contribute greatly to the longevity and strength of your home’s structural integrity. Age of a home is one of the largest negatives when it comes to the price of house insurance because the older the home the more likely there are defective, outdated, and deficient structural components that are likely more apt to fail or be at greater risk. The design of the house is also a huge consideration to carriers when quoting your policy. When considering buying a home it’s a good idea to look at a newer home (no more than 20 years old) if saving money is something you are concerned with. If your home was built in 2008 or later, make sure you are getting credit from your insurance company for having a home that meets modern building codes. Also, if your home has a hip roof – a pyramid-like roof that slopes on four sides – be sure your insurer is factoring that into your rate, because hip roofs are more hurricane-resistant than gable roofs.The amount of the incentive varies according to risk associated with the geographical location, building materials, and construction methods of each home as well as actuarial data from individual insurance companies. (Discounts apply only to the hurricane-wind portion of your policy; contact your insurance agency for more information.)Considering all this, you may still qualify for a DISCOUNT ON YOUR HOMEOWNERS INSURANCE. To qualify you must submit an inspection from a state certified wind mitigation inspector, licensed contractor, building inspector, architect, or engineer, legally validating and identifying the existence of any wind mitigation measures such as below: (Insurance providers will have the form needed to give to one of the experts listed above).
Type of Windows (quality and impact resistant wind rating)
* For Flood Insurance – Newer foundation Vents (such as smartvents.com)If you have a hip roof, permanently installed approved shutters for windows and doors or any of the above credits you may qualify for discounts on the wind portion of your insurance policy.The most likely discount for home- owners to overlook is roof tie-downs, generally metal clips or straps attaching the roof structure to walls of the home. Qualifying roof tie-downs can result in an annual premium discount in the low single-digits, but that could add up to real money if you’re owed a retroactive discount.
Info Gathered From: American Property Consultants
Keep in mind that each year it is very likely your insurance premiums will increase and honestly for no other reason than your insurance provider wants to make more money, and feels they can justify the increase because the house is one year older. So it’s a good idea to shop your home’s insurances EVERY year to save money.
Prior to the real estate crash that began in 2007 it was hard enough to get good mortgage loans for special real estates sales like: Charleston, SC jumbo loans, mortgages for investment properties, and fractional ownership home loans. Now after the economic and banking crash banks willing to lend money on riskier assets has become all but impossible without giving up your first born. Below are the basics with getting started with financing investment properties in the Charleston, SC area. I am a local Charleston SC real estate broker with over 13 yrs mortgage experience and once founder/CEO of Mortgage Professionals, LLC wholesale mortgage firm. Please feel free to contact me to discuss your home buying plans in Charleston so we can figure out the best method to achieve your goal. Although I do not write mortgage loans any longer I know and work with the best mortgage lenders in the country and still know what I am doing with regards to how to get financing. Mortgage Loans for second homes is different from that of purchasing homes for investment purposes only. Reserve requirements vary depending on the number of financed properties owned (including primary residence): 1-4 financed properties owned:
2 months of reserves on the subject property if it’s a second home.
6 months reserves on subj. property if it’s an investment property plus 2 months reserves on each other second home or investment property.
5-10 financed properties owned:
2 months of reserves on the subject property if it’s a second home.
6 months of reserves on the subject property if it’s an investment property plus 6 months reserves on each other financed second home or investment property.
Note: Freddie Mac’s guidelines are *currently* 6 months PITI. Other underwriting changes for investment properties include:
70% LTV for purchase of 1-unit and 70% for 2-4 units.
720 minimum low-mid credit score.
No history bankruptcy or foreclosure in the past 7 years.
Rental income must be documented with two years tax returns.
Don’t forget that there is a significant price hit of 0.75% to fee from Fannie and Freddie with investment properties on top of the credit score/loan to value adds (LLPA). Seller contribution is limited to 2% of the sales price with investment property. Underwriters will be very strict on investment properties in today’s real estate climate so be prepared.
If you are thinking of buying investment property contact me and we can discuss your options before we go house hunting.
Building a new home can be an exciting thing, but it has a lot of things to consider. Even if you are just building with a large national builder there is more to it than one might imagine. So one might as themselves is it worth it to build new? Should I buy an existing home? There are some factors to consider when building a new home.If you ask a mortgage loan officer they are going to try to steer you toward buying a built home instead of building because getting a construction loan is a almost impossible these days. Trust me I know because I was in the mortgage business for over 13 years. My suggestion is if you absolutely have to have a new home, then try to find a semi-custom “spec” (speculative) home. Meaning a developer buys a large plot of land and has multiple house plans from you to choose from. IF you and your real estate agent get under contract on a home that is in the middle of construction but not yet sold your home builder will usually let you pick out many things that fit your taste. Like: the type of flooring, paint colors, trim packages, counter tops, cabinets, even type of roof material, and landscaping so you get a new home with a custom feel without all the hassle of having to hire an architect, permitting, etc.Since I am Charleston, SC real estate agent, built my own home, and once owned a mortgage company I will answer the question for you from my experience.To be honest with you building is kind of a pain, unless you have a great home builder and bank. Right now banking and mortgage lending is NOT smooth sailing. It was a pain getting a construction loan when anyone with a pulse could qualify in 2004-2006. So getting a construction loan now is even more of a nightmare. As an ex- mortgage loan professional I would not suggest building just for that reason alone. You have to put down a lot more money then you would have to for just a traditional purchase.If you still want to build just be prepared for a busy few months. Depending on the size of home, the finishes, the town you are building, among others, the process can be from 4 months to 2+ years. There are many meetings involved, decisions to be made, and things to consider, and with a lot of people. IF you really do your homework and find a great reputable, experienced builder then you can make your process a little easier. In any event building a home is not usually an enjoyable experience, simply because there are so many choices and changes, that can test your nerves.Precision Construction is Charleston’s best Affordable Home BuilderIn closing my suggestion is to seriously think about it before making a decision. You may even consider buying an older home, or a foreclosure and renovating it to look new. If you want a like new home then I suggest letting me find you home that needs a lot of work then let a contractor redo it to your liking. Then you can make changes, additions, and improvements that will suit you. Sometimes when doing a renovation it too can also be a difficult process for getting money from a bank, but one loan that is tailored for this type of process is a 203k from FHA. Make sure you specifically ask about this type of loan and make sure your mortgage loan officer is very very familiar with this type of loan.If you have decided you absolutely have to have new construction, but don’t think you want to deal with the hassles that come along with building one yourself, you can always look for an already built spec home or at least one already started. This is where a real estate agent can be a huge help.
Finally. Phew!.. I was beginning to get worried, and I think most were that the small bright spot in housing was beginning to dim. Mortgage rates were SO low for so long I guess it was inevitable that they would have to come up but a few months ago I don’t think people thought they would skyrocket a half point over night almost. However that’s exactly what happened this summer when the Fed Chairman talked about possibility of the government cooling its purchase of treasuries (a.k.a tapering) thus increasing mortgage rates.
Mortgage lenders in Charleston SC have seen applications for home loans fall slightly in the latest weeks as a drop in demand from home buyers outweighed an increase in demand from those looking to refinance, the Mortgage Bankers Association said this week.
Worry no more, currently rates are back down to a very attractive 4%. As of October 3rd, mortgage interest rates fell to their lowest level since June, but will likely level off. As of today rates are at 4.08% and have been that way every since the first week in Oct. Fingers crossed. The latest drop in rates came amid declining consumer confidence and because of the of the government shutdown, says Frank Nothaft, Freddie Mac chief economist.
Why is it that the bond market is so vital to mortgage rates you ask? Treasure bonds are mortgage backed securities and the purchase and sale of treasuries directly impact the rise and fall of rates throughout the day. Since the economic crash the U.S. Government has artificially affecting mortgage rates to keep them low through purchasing billions of dollars of treasury bonds each month with the public’s money. That’s not such a bad thing.. Seems to be a good investment don’t you think? Artificially you ask? Yes; because truthfully (at least in my opinion) investment firms, financial advisers, IRAs, and the like in the markets who buy and sell these should be the only thing effecting this not the government.
Mortgage rates pushed up from historic lows in May and bounced higher to mid-August before leveling off. They’ve been trending downward in recent weeks since the Federal Reserve said last month it will not begin tapering its monthly purchases of mortgage-backed securities and Treasuries, which has kept interest rates low.
Often time, prospective home-buyers become homeowners by securing a secured mortgage loan in the first instance and then subordinate them with a second mortgage loan, often known as the home equity loan. Due to the poor economic condition in the economy, too many households and individuals are suffering from lack of funds and therefore are not being able to manage the mortgage payments on both their first mortgage loan and second mortgage loan. While the first mortgage loan or the original loan on the property can be modified, most struggling homeowners are wondering about the chances and prospects of modifying their second mortgage loan. If your first mortgage loan has been modified under the Home Affordable Modification Program, you can be sure that this Federal government modification program will also help you achieve affordable payments on your home equity line of home equity line of credit.Second liens on your home – Modifying themThe second mortgage loans are usually called home equity loans or second liens. Technically, the second liens are bound to be subordinate to the first mortgage loans. While you opt for loan modification on your first mortgage loan, the high payments on the second mortgage loan can still be taking a toll on your personal finances. But you need not fret as there is a federally sponsored program called the Home Affordable Second Lien Modification program, abbreviated as the 2MP, they might help the struggling homeowners to alleviate the stress of making sky-high payments on their second liens.Eligibility criteria for modifying your second mortgage loanNow that you know that there is a federally sponsored program through which you can modify your second mortgage loan, you must be wondering about the eligibility criteria. Your first mortgage loan requires to be modified under the HAMP, and apart from this, the 2MP applications shouldn’t have missed 3 continuous monthly installments on their HAMP modification arrangements. The second lien or home equity account needs to be opened before 1st January, 2009 if the borrower wants to qualify for the 2MP. You should not have been convicted of theft, felony or forgery in relation with a mortgage transaction since the last 10 years. Besides, the individual mortgage lenders who participate in 2MP might even have their own requirements; for instance, you might have to owe at least $5000 on your second mortgage loan for qualifying for 2MP.The potential benefits of loan modification through 2MPIf you’re someone who’s struggling to meet your monthly mortgage payments on the second mortgage loan, you can follow some guidelines in order to qualify for the same. Check out some benefits that you may reap when you modify your second mortgage loan through the 2MP.1. The interest rate that you pay on an interest-only home loan might be slashed off by 2%
2. The interest rate on the second mortgage loan will be revised by up to 1%
3. The lender may forgive a portion of the second mortgage loan under the terms of the 2MP
4. The forbearance that you receive on the first mortgage loan can be carried over to the second
5. The repayment term of the second mortgage loan could be extended to 40 years.The names of the servicers who are presently participating in 2MP are Bank of America, CitiMortgage, Inc., GMAC Mortgage, LLC, J.P Morgan Chase Bank, NA, Bayview Loan Servicing, LLC, Wells Fargo Bank, NA, Nationstar Mortgage LLC and many more. Check the availability of your lender before taking the plunge into the 2MP. Take into account the above mentioned details on second mortgage modification so that you may take an informed and measured decision. The sooner you modify the loan, the easier it will be for you to repay the loan and safeguard your home.
 for years on hundreds of thousands of homeowners who buy flood insurance from the federal government. Important points are:
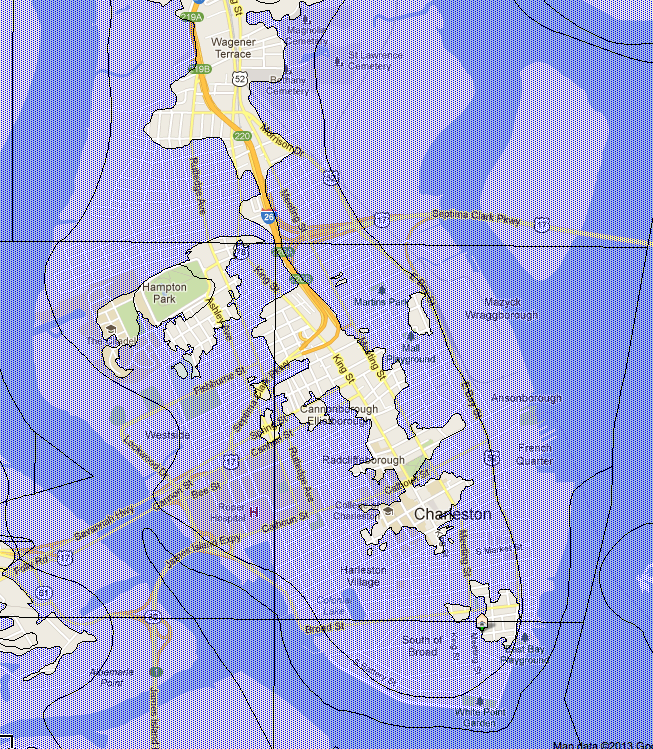
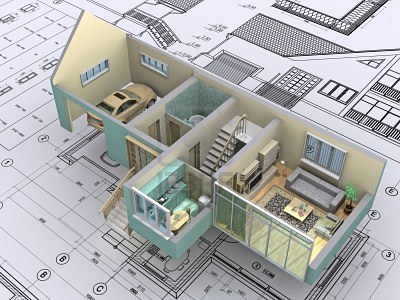 what
what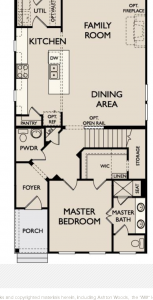 family heirlooms? If this applies to you then you need to consider how much space is available for storage, and what unused space in the home can be converted to a storage space. Many home plans have tiny nooks here and there that can be fitted with a door and lined with plywood to make for extra storage space. But wait; how accessible is the storage space that is in the home? Meaning, are you going to have to squeeze in and out of closets, and walls to get to your storage spaces. You may want to consider having a floor plan that has storage in the main parts of the home and not just the attic or basement because if you need to access things you put into storage a lot it will get annoying to go up and down the stairs.
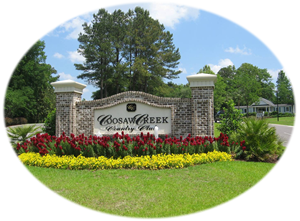 and Volvo just to name a few and have heard bad things about North Charleston let me first start by saying that North Charleston is a great area with many great neighborhoods, but one that I really like is Coosaw Creek. As a Realtor I will gladly help you, and show you homes throughout all of North Charleston, but I simply wrote this article as a to feature this particular gated community. So look out for other articles about other communities in the Low-country. To see schools in this area click


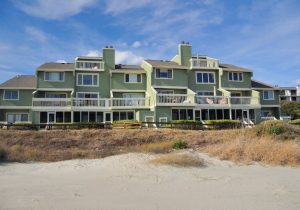 resort vacation rentals. It’s no mystery that homes in beach communities are very attractive year round and hundreds of thousands of visitors come to our beaches in S.C. to unwind.


 The factors that determine the cost of your home’s insurance expenses varies greatly as one can imagine. However, here in Charleston SC there are additional concerns that we have to consider like; wind from hurricane’s, flooding from, and the intense heat our summers bring. All these contribute greatly to the longevity and strength of your home’s structural integrity. Age of a home is one of the largest negatives when it comes to the price of house insurance because the older the home the more likely there are defective, outdated, and deficient structural components that are likely more apt to fail or be at greater risk. The design of the house is also a huge consideration to carriers when quoting your policy. When considering buying a home it’s a good idea to look at a newer home (no more than 20 years old) if saving money is something you are concerned with. If your home was built in 2008 or later, make sure you are getting credit from your insurance company for having a home that meets modern building codes. Also, if your home has a hip roof – a pyramid-like roof that slopes on four sides – be sure your insurer is factoring that into your rate, because hip roofs are more hurricane-resistant than gable roofs.The amount of the incentive varies according to risk associated with the geographical location, building materials, and construction methods of each home as well as actuarial data from individual insurance companies. (Discounts apply only to the hurricane-wind portion of your policy; contact your insurance agency for more information.)Considering all this, you may still qualify for a DISCOUNT ON YOUR HOMEOWNERS INSURANCE. To qualify you must submit an inspection from a state certified wind mitigation inspector,

 The second mortgage loans are usually called home equity loans or second liens. Technically, the second liens are bound to be subordinate to the first mortgage loans. While you opt for loan modification on your first mortgage loan, the high payments on the second mortgage loan can still be taking a toll on your personal finances. But you need not fret as there is a federally sponsored program called the Home Affordable Second Lien Modification program, abbreviated as the 2MP, they might help the struggling homeowners to alleviate the stress of making sky-high payments on their second liens.Eligibility criteria for modifying your second mortgage loanNow that you know that there is a federally sponsored program through which you can modify your second mortgage loan, you must be wondering about the eligibility criteria. Your first mortgage loan requires to be modified under the HAMP, and apart from this, the 2MP applications shouldn’t have missed 3 continuous monthly installments on their

You must be logged in to post a comment.